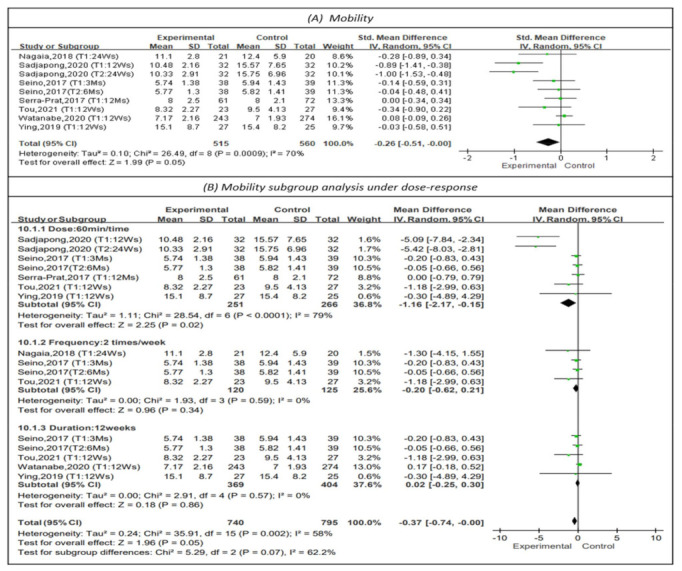
Figure 8.

Forest plot of effects on mobility and subgroup analysis for dose-response. The size of the green square represents the weight of the study in the meta-analysis. The rhombus represents the combined OR. OR = odds ratio.

Forest plot of effects on mobility and subgroup analysis for dose-response. The size of the green square represents the weight of the study in the meta-analysis. The rhombus represents the combined OR. OR = odds ratio.