Fig. 4.
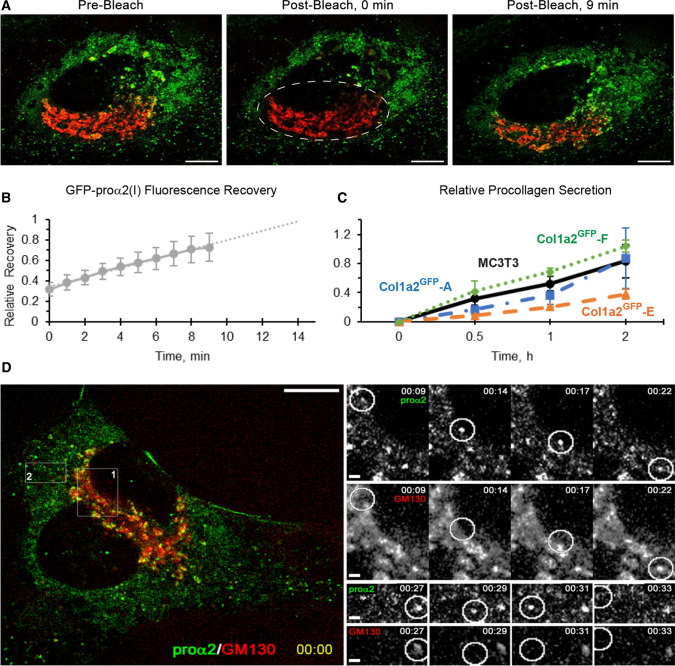
Procollagen trafficking through the cell. a and Movie 1 Golgi (red) refill by fluorescent GFP-proα2(I) (green) in a Col1a2GFP-A cell after photobleaching of GFP-proα2(I) in the Golgi area (dashed oval in the middle panel). Scale bars = 10 µm. b Kinetics of GFP-proα2(I) fluorescence recovery after photobleaching averaged over 5 different cells (1 = full recovery). c Relative kinetics of procollagen secretion per cell (1 = maximum average secretion). Each experiment was done in triplicate with one or two Col1a2GFP clones and MC3T3 control at the same time. Since all experiments produced consistent results, the values were averaged over all cultures: Col1a2GFP- A (N = 9), E (N = 6), F (N = 3), and MC3T3 (N = 12). d and Movie 2 Time-lapse images of rapidly moving transport vesicles delivering GFP-proα2(I) from the ER to Golgi (box 1) and from Golgi to the plasma membrane (box 2) of a Col1a2GFP-A cell. In a and d, cis-Golgi cisternae (red) were marked by transfecting the cells with cis-Golgi marker mCherry-GM130 in the presence of Asc2P. Scale bars = 10 µm (whole cell) and = 1 µm (zoomed regions). In b and c, error bars show SEM

