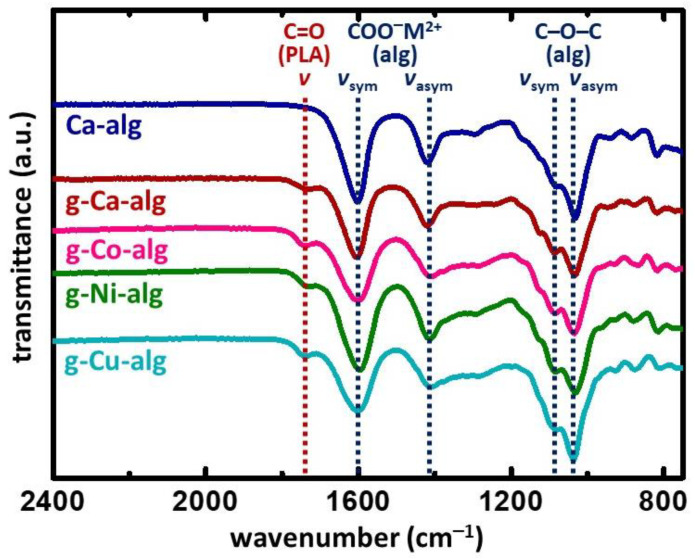
Figure 2.
ATR-FTIR spectra of M-alginate and g-M-alginate aerogels, as indicated. Dotted lines mark the bands corresponding to the characteristic vibrations discussed in the text. The PLA content in the aerogels was in the range of 14–29% w/w (see Table 1).

