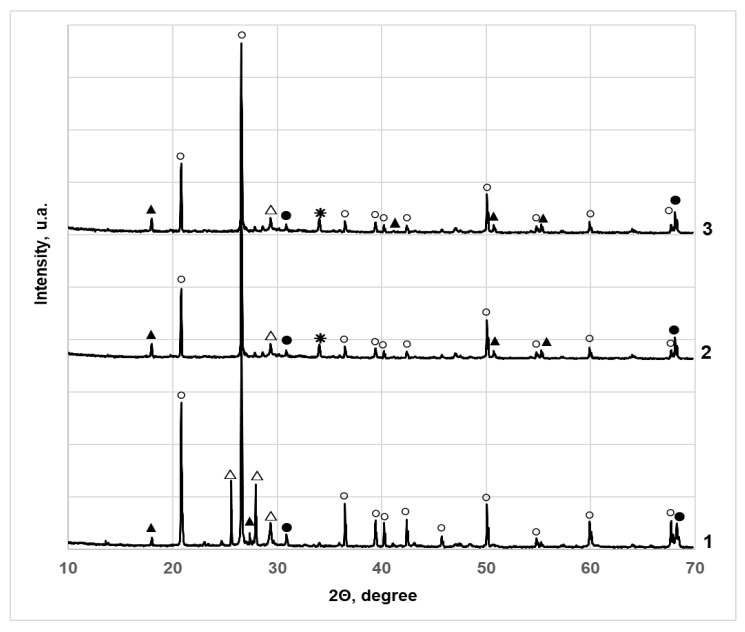
Figure 9.
X-ray diffractograms of sandy SCS samples with different amounts of additives: 1–10% Carbofill E and Cr (VI) 3000 mg/kg; 2–20% Carbofill E and Cr (VI) 3000 mg/kg; 3–10% Carbofill E and Cr(VI) 30,000 mg/kg. The peaks were identified and assigned as follows: (○) quartz SiO2 83–539; (▲) wollastonite 2M (monoclinic) CaSiO3 84–655; (△) wollastonite 2M (monoclinic) Ca3(Si3O9) 76–1846; (●) calcium chromium oxide (hexagonal) Ca5(CrO4)3O0.5 38–294; (✳) chromium oxide (rhombohedral) Cr2O3 84-315.

