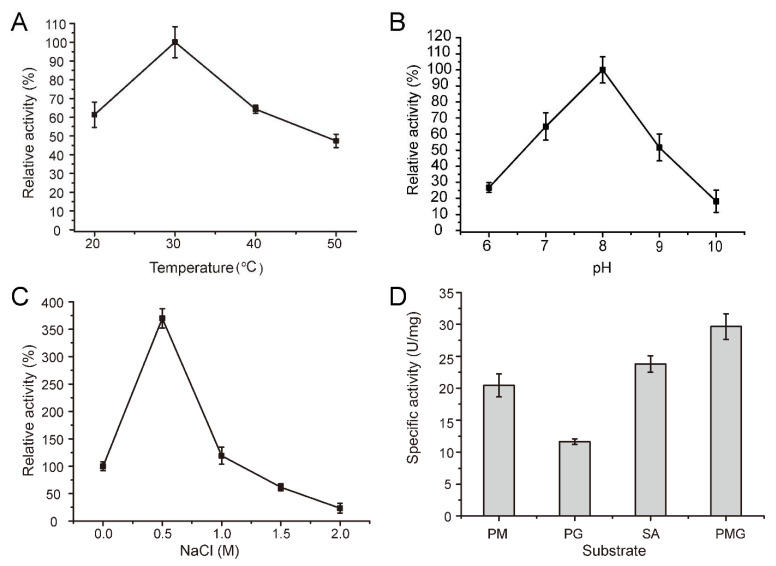
Figure 6.
Biochemical characterization of AlyM2. (A), effect of temperature on AlyM2 activity. The highest activity at 30 °C was taken as 100%. (B), effect of pH on AlyM2 activity. The highest activity at pH 8.0 was taken as 100%. (C), effect of NaCl concentration on AlyM2 activity. The activity at 0 M NaCl is taken as 100%. (D), the substrate specificity of AlyM2 towards PM, PG, PMG, and sodium alginate (SA).

