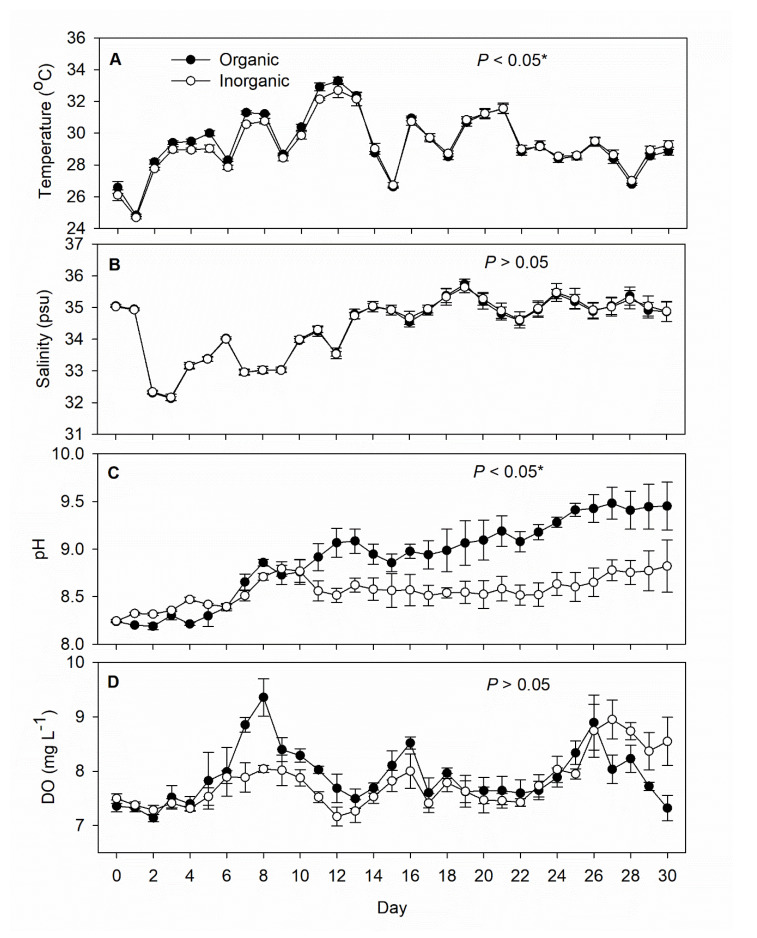
Figure 1.
Daily records (mean ± SD) of (A) temperature, (B) salinity, (C) pH, and (D) dissolved oxygen in the inorganic (N = 5) and organic (N = 5) fertilization tanks during the 30-day experimental period. The p-value in each panel indicates the significance level (*, α = 0.05) of the treatment effect based on repeated measures ANOVA.

