Fig. 1.
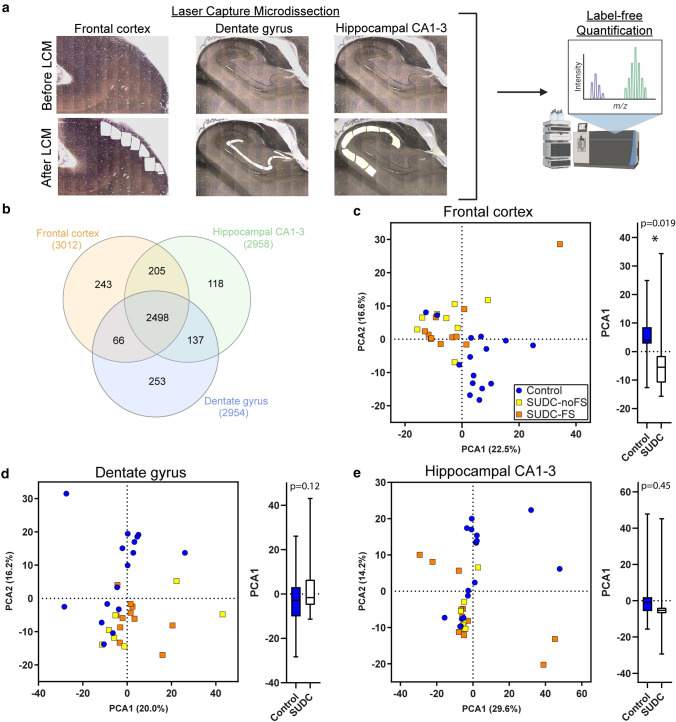
Detected proteins and PCA from proteomics analyses in frontal cortex, dentate gyrus, and hippocampal CA1-3. a Number of proteins detected in each brain region by label-free quantitative MS is indicated, with an overlap of 2498 proteins detected in all brain regions. b The PCA in the frontal cortex shows separation of control (n = 15) and SUDC (n = 19) cases. In the hippocampus, the variation is indicated for c the dentate gyrus (control n = 16, SUDC n = 18) and d the hippocampal CA1-3 (control n = 17, SUDC n = 18). An analysis of group separation in PCA1 for each brain region is depicted by a box plot with bars indicating minimum and maximum values, evaluated by an unpaired two-tailed t test. PCA1 principal component analysis 1, PCA2 principal component analysis 2

