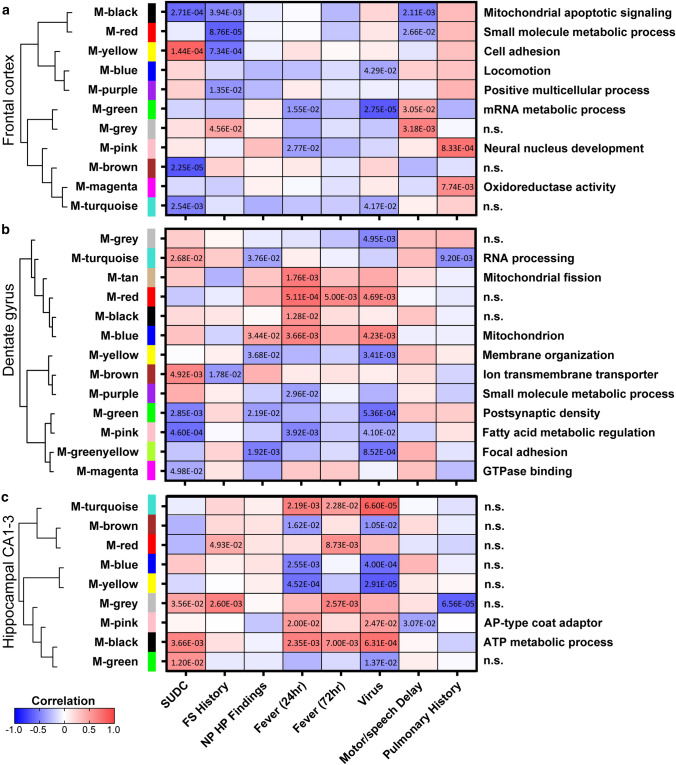
Fig. 4.
WGCNA of clinical variables in frontal cortex, dentate gyrus, and hippocampal CA1-3. A correlation analysis of clinical variables to proteomics indicated significant modules and associated GO annotations in the a frontal cortex b dentate gyrus, and c hippocampal CA1-3. Modules are clustered by eigenprotein adjacency (relatedness to other modules) on the left. Name of module is indicated by “M-color” and corresponding color block. P values are indicated for those modules with p < 0.05 correlation. Positive correlation is indicated in red and negative correlation in blue. Top module GO annotations are noted on the right (FDR < 5% with at least 5 proteins) and detailed in Supplementary Table 13–15, online resource. Several modules did not have a significant GO annotation and are noted as “n.s.” FS febrile seizure, NP HP findings neuropathology hippocampal findings

