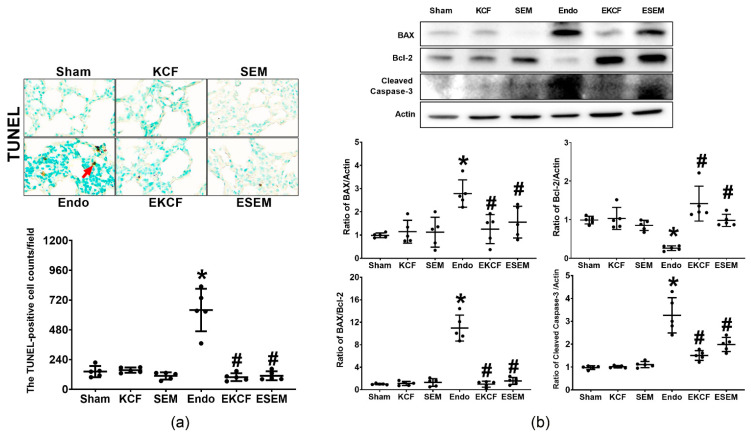
Figure 8.
Lung apoptosis status. (a) Representative DNA fragmentation microscopic images (the indicator of apoptosis, marked by the red arrow, 200×) in lung tissues assayed using the terminal deoxynucleotidyl transferase dUTP nick end labeling (TUNEL) method and the count of TUNEL-positive cells (0.25 mm2). (b) Representative gel images of the proapoptotic BAX, the antiapoptotic Bcl-2, proapoptotic cleaved caspase-3, and actin (the internal standard) in lung tissues assayed using immunoblotting assay and the relative band density of BAX/actin, Bcl-2/actin, cleaved caspase-3/actin, and BAX/Bcl-2 ratios in lung tissues. All assays were measured at 24 h after endotoxin or normal saline administration. Sham: the normal saline group. KCF: the normal saline plus the KCF18 peptide group. SEM: the normal saline plus the SEM18 peptide group. Endo: the endotoxin group. EKCF: the endotoxin plus the KCF18 peptide group. ESEM: the endotoxin plus the SEM18 peptide group. Data were obtained from 5 mice in each group and presented as the mean ± standard deviation. * p < 0.05, versus the Sham group. # p < 0.05, versus the Endo group.

