Figure 2.
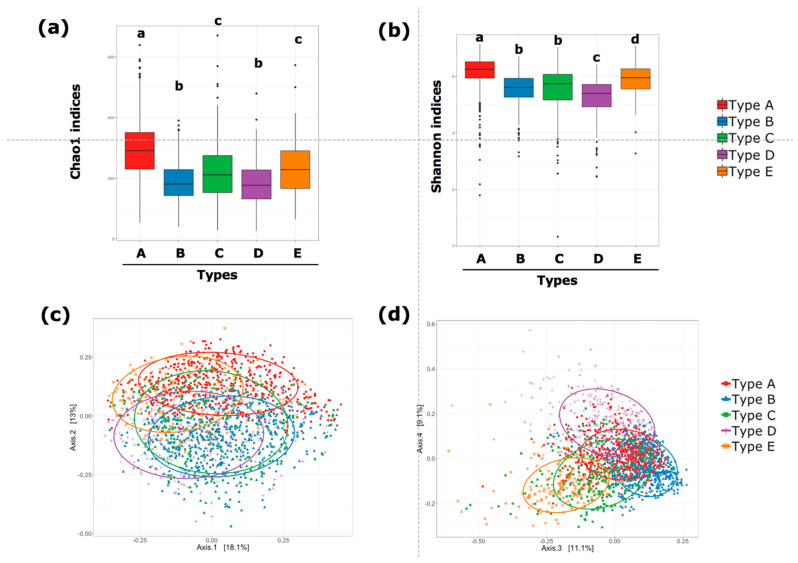
α-diversity and β-diversity of gut microbiota for five PAM-identified communities. α-diversity assessed by Chao 1 index (ASV richness estimation) (a) and Shannon index (ASV evenness estimation) (b). Statistical differences in α-diversity indices among the groups were evaluated using one-way ANOVA. Statistical significance (p < 0.05) is indicated by different letters. β-diversity represented by principal coordinate analysis plots based on Bray–Curtis dissimilarity. Axis 1 and axis 2 (c) and axis 3 and axis 4 (d). Ellipses enclosing the clusters indicate an 80% confidence interval. Statistically significant differences in β-diversity among the groups were confirmed using PERMANOVA (p = 0.001).

