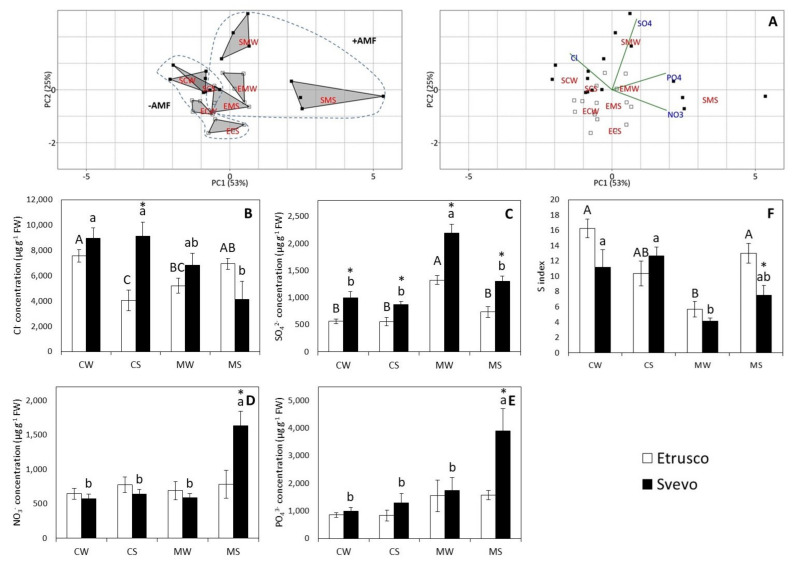
Figure 6.
Anion concentration in Svevo and Etrusco leaves: (A) the principal component analysis (PCA) with scatterplot (left) and biplot (right) projections of the data onto the subspace spanned by both components (PC 1 and PC2), which are colored according to cultivars with each group labeled with its condition class. Etrusco is represented by white squares and Svevo by black squares. Abbreviations: -AMF, not mycorrhizal plants; +AMF, mycorrhizal plants. The chloride (Cl−) (B), sulfate (SO42−) (C), nitrate (NO3−) (D), phosphate (PO43−) (E), and S index (F) in the leaves of two durum wheat cultivars grown under control well-watered (CW), control stressed (CS), mycorrhized watered (MW), and mycorrhized stressed (MS) conditions. Etrusco is represented by white bars and Svevo by black bars. Data are presented as the mean ± SE (n = 4) and significant differences between the Etrusco and Svevo plants (within conditions) are indicated as follows: * p < 0.05. Different letters indicate significant differences between conditions within a genotype (uppercase letters for Etrusco and lowercase letters for Svevo) (Tukey’ test, p < 0.05). An absence of letters means that there were no significant differences between conditions. The two-way ANOVA results are reported in Table S6.

