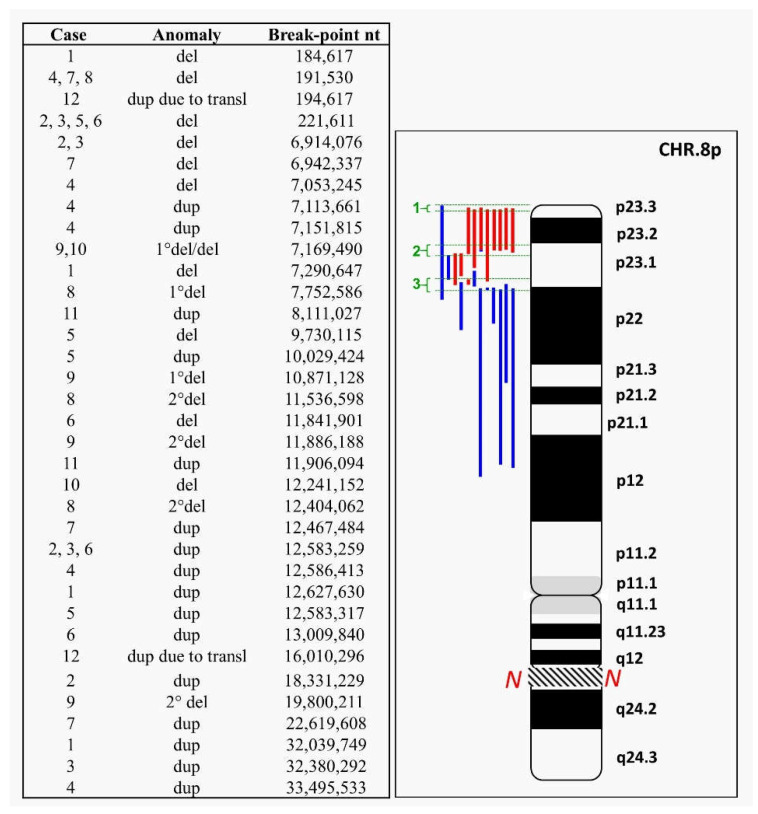
Figure 1.
Graphical representation of chromosome 8 aberrations described in this study. Left: in the third column, from top to bottom, the identified breakpoints are reported from most distal to most proximal; in the middle, the alterations are specified as in the figure (see below); and in the first column, the cases in which they have been identified. Right: red bars: deletions (del); blue bars: duplications (dup). Green brackets show the most frequent breakpoint intervals: interval 1 is the most telomeric, in 8p23.3, from nt 184,617 to nt 221,611; intervals 2 and 3 are in 8p23.1, from nt 6,942,337 to nt 9,730,115 and from nt 10,029,424 to nt 12,627,630, respectively. The region of the 8q arm not shown in the figure is indicated by the N.

