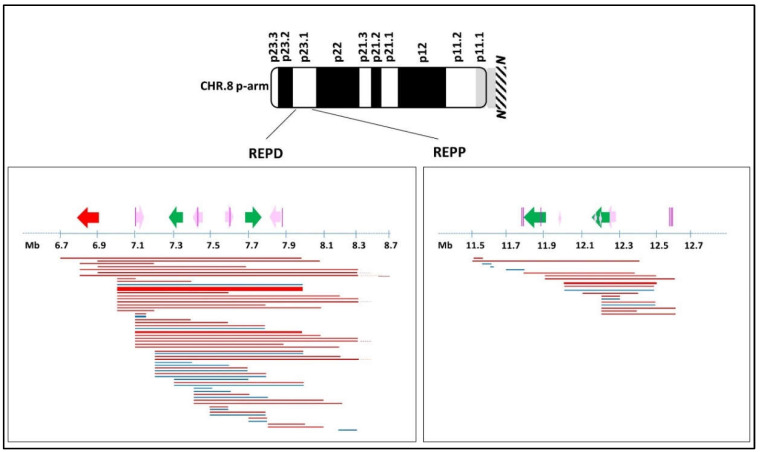
Figure 7.
Schematic diagram of benign CNVs on 8p identified in our cohort. Defensin gene clusters and OR/FAM clusters are represented by colored arrows: red, α-defensin; green, β-defensin; pink, OR/FAM clusters. The direction of the arrows indicates cluster orientation. Purple vertical lines: OR7 family at 8p23.1. Horizontal lines: benign CNVs: losses are red; gains are blue. Line thickness: frequency of the CNV in our cohort where the thinnest is for ≤40 patients; the largest is for the most frequent CNV (≥500 patients); the middle lines are for intermediate situations (around 100 patients). The region of the 8q arm not shown in the figure is indicated by the N.

