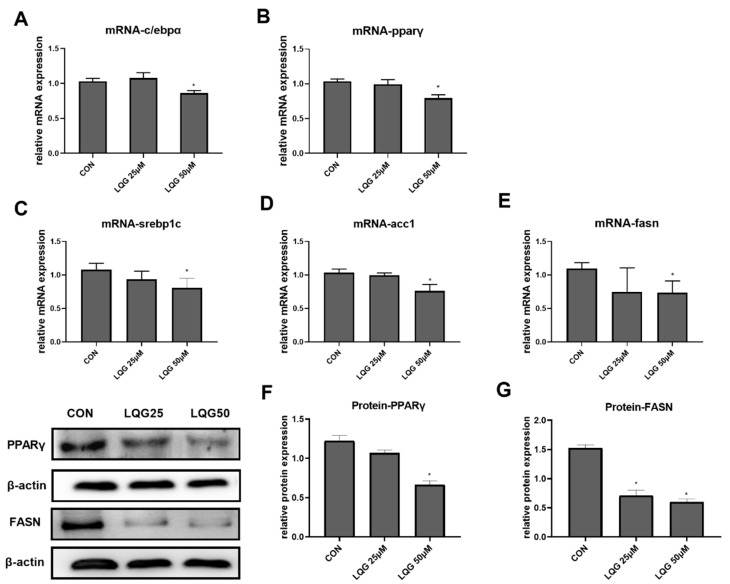
Figure 2.
Effects of LQG on molecular regulators of lipid synthesis in 3T3-L1 adipocytes. The cells were treated with 25 and 50 μM LQG. The mRNA-expression levels of (A) c/ebpα, (B) pparγ, (C) srebp1c, (D) acc1, and (E) fasn were measured by RT-PCR, and the protein levels of (F) PPARγ and (G) FASN were analyzed by Western blotting. Protein expression was quantified by densitometry, and the relative intensities are expressed in the bar charts. Values are presented as means ± SEMs (n = 3) and analyzed with one-way ANOVA. * shows a statistically significant difference compared with control group (p ≤ 0.05).

