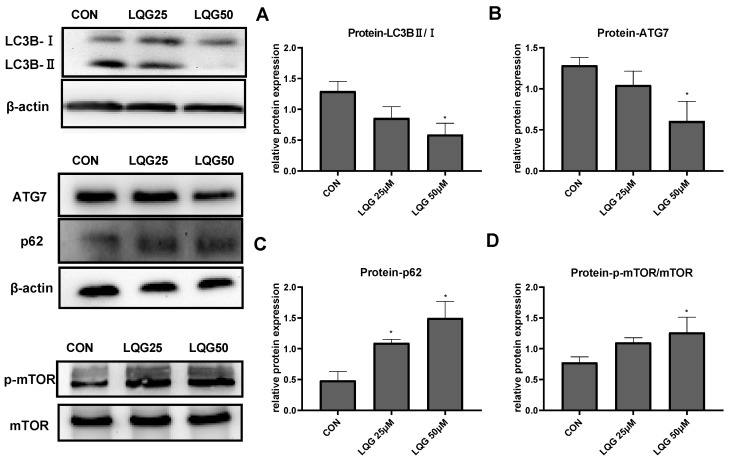
Figure 3.
Effects of LQG on autophagy-related protein expression in 3T3-L1 adipocytes. The cells were treated with 25 and 50 μM LQG. The protein expression levels of (A) LC3B, (B) ATG7, (C) p62, and (D) phosphorylated-mTOR (p-mTOR) were analyzed by Western blotting. The results are means ± SEMs of three independent experiments and analyzed with one-way ANOVA. * marks significant differences compared with control group (p ≤ 0.05).

