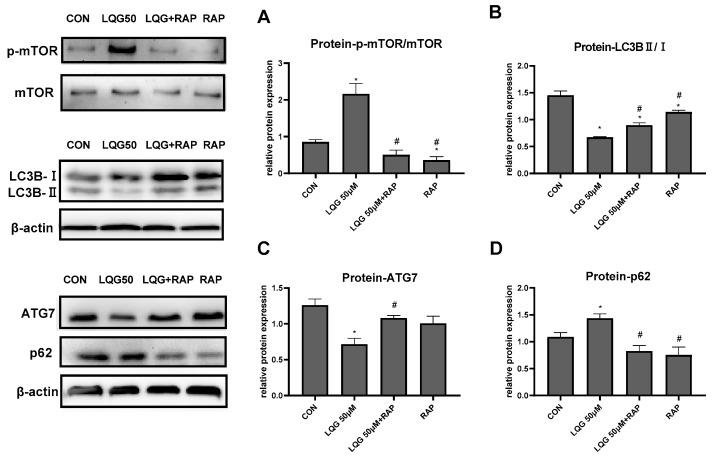
Figure 4.
Effects of rapamycin (RAP) on modulating autophagy-related factors in LQG-treated 3T3-L1 cells. The cells were divided into four groups: control group, 50 μM LQG group, LQG + RAP group, and RAP-alone group. Protein expression of (A) p-mTOR and mTOR, (B) LC3BII/LC3BI, (C) ATG7, and (D) p62 were quantified by densitometry, and the relative intensities are expressed in the bar charts. Western blotting bands represent detection of the proteins from three independent tests. Data are presented as means ± SEMs and analyzed with one-way ANOVA. * vs. control group (p ≤ 0.05); # vs. 50 μM LQG-alone treatment group (p ≤ 0.05).

