Figure 7.
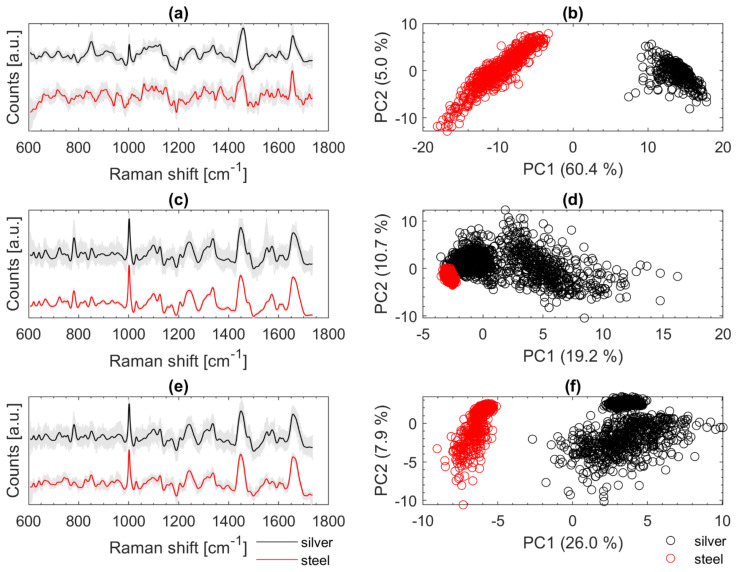
Baseline corrected and smoothed Raman spectra of Cal (a), Eco (c), and Oan (e) recorded on silver mirror slide (black) and stainless-steel slide (red); PCA calculated with the Raman spectra recorded on silver mirror slide (black) and stainless steel slide (red) of Cal (b), Eco (d), and Oan (f); for better visualization of the spectra on the left an offset was calculated in (a,c,e) but the spectra for calculating the PCAs on the right (b,d,f) were all treated the same.

