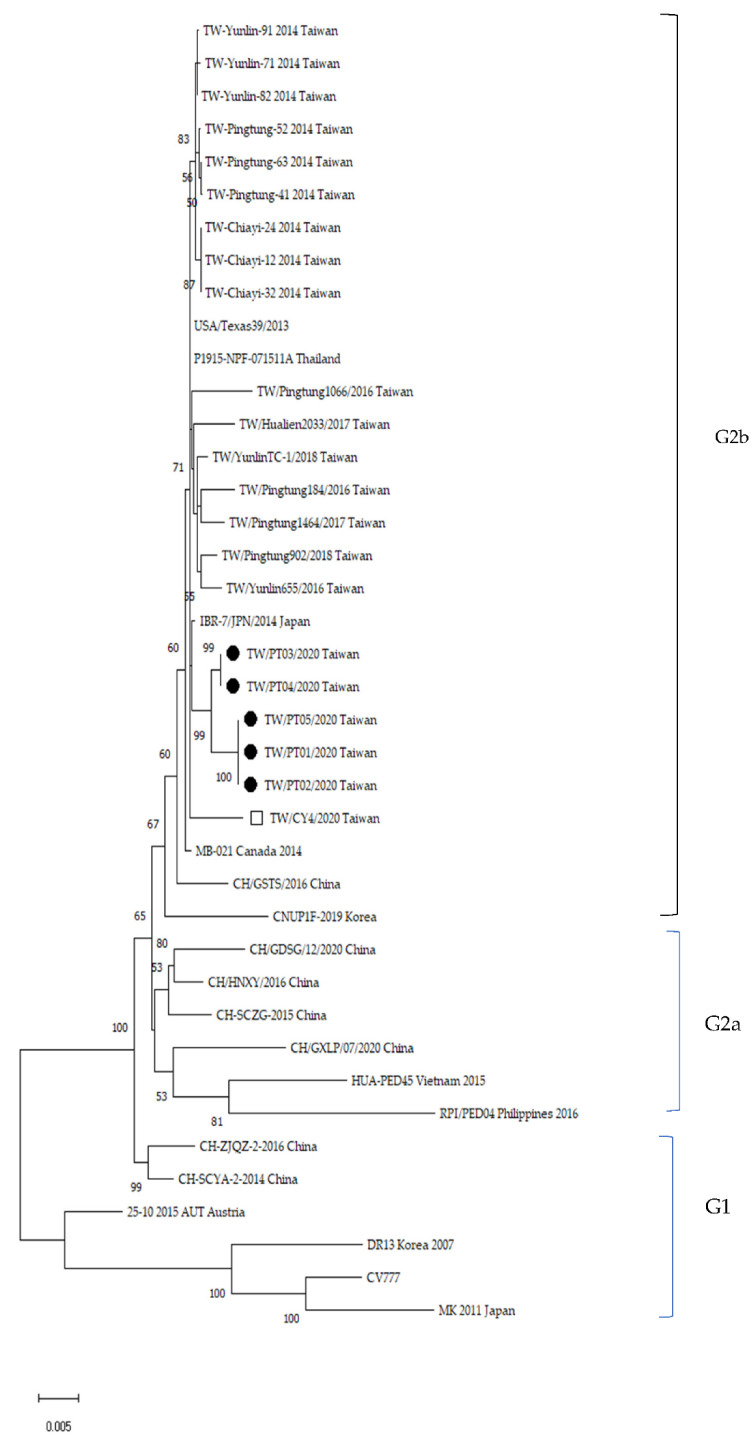
Figure 3.
Phylogenetic tree of PEDV strains based on full-length spike gene generated by the Maximum Likelihood method with the Kimura two-parameter model, using the MEGA software. Bootstrapping with 1000 replicates was performed to determine the percentage reliability for each internal node. Horizontal branch lengths were correlated to genetic distances among PEDV strains, with different genogroups labeled on the right. Black solid circles represent PEDV strains isolated from the SL farm that used feedback. The hollow square represents CY4 strains isolated from the CL farm with no feedback. The scale bar represents nucleotide substitutions per site.

