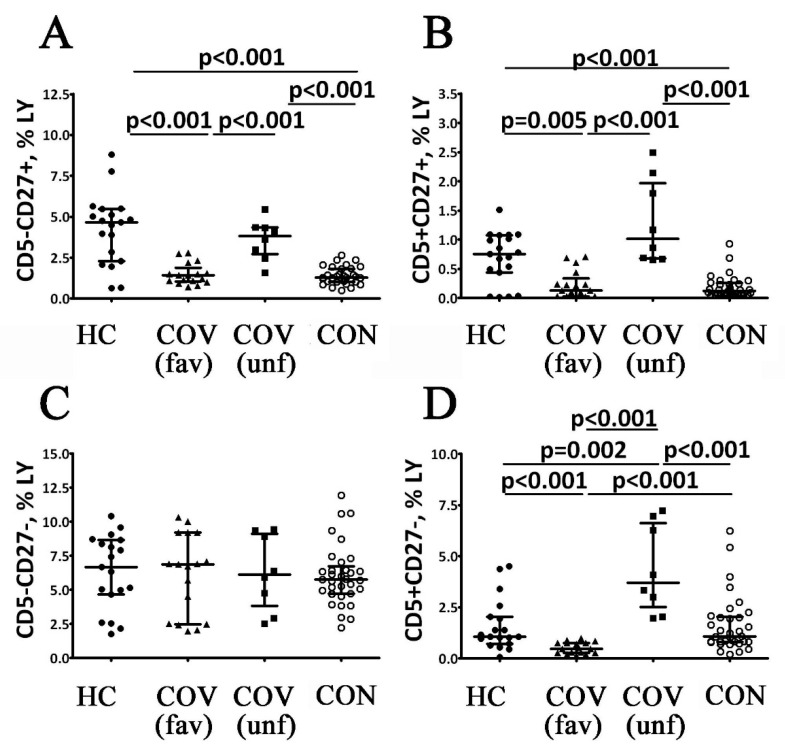
Figure 5.
Alterations in relative numbers of B cell subsets with different patters of CD5 and CD27 expression in patients with acute COVID-19 and COVID-19 convalescent patients. Scatter plots (A–D) show the percentages of CD5−CD27+, CD5+CD27+, CD5−CD27− and CD5+CD27− B cells, respectively. The data represents the percentages of B cell subsets within the total lymphocyte population. Black circles—healthy control (HC, n = 24); black triangles—patients with acute COVID-19 (COV (fav), favorable outcome, n = 25); black squares—patients with acute COVID-19 (COV (unf), unfavorable outcome, n = 8); and white circles—COVID-19 survivors (CON, convalescent patients with favorable outcome of acute COVID-19, n = 33). Each dot represents individual subjects, and horizontal bars depict the group medians and quartile ranges (Med (Q25; Q75). Statistical analysis was performed with the Mann–Whitney U test.

