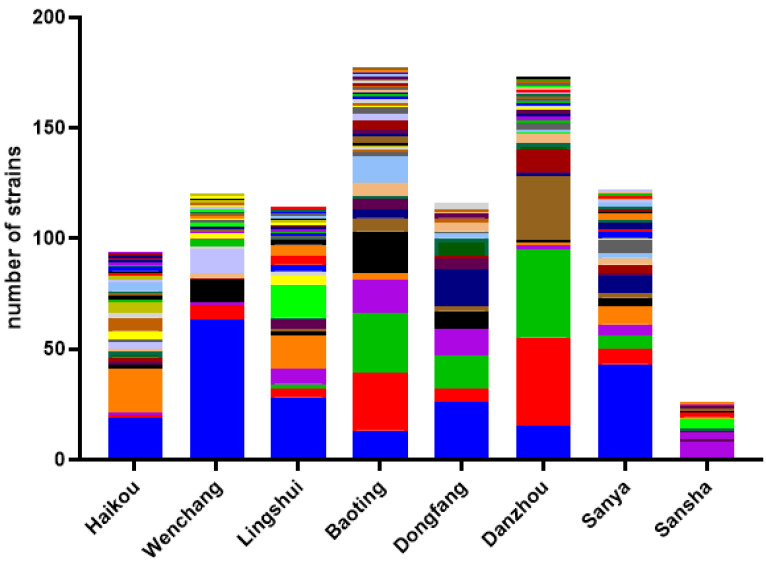
Figure 2.
Diversity and abundance of culturable environmental yeasts within each of the eight geographic samples. Labels on the X-axis represent the eight geographic regions. The yeast diversity of each geographic region is represented by a stacked bar plot. In the stacked bars, each color represents a unique species, and the height of the colored sections indicates the abundance of that species in the population. For detailed prevalence of each species at each region, see Table S1.

