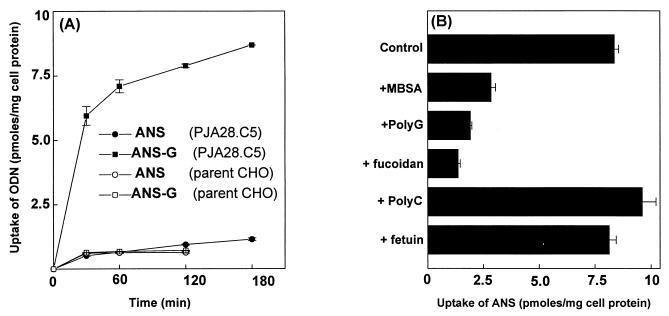
FIG. 6.
Enhanced uptake of ANS-G by parent CHO cells and PJA28.C5 cells expressing SCR. (A) The assay was performed as described for Fig. 3A. Results shown are means ± standard errors for three independent determinations. ODN, oligonucleotide. (B) Assay was carried out as described for Fig. 3B. Cells received 1 μM 32P-labeled ANS-G (specific activity: 390 cpm/pmol) either alone or along with different competitors, viz., MBSA (500 μg/ml), poly(G) (7 μg/ml), fucoidan (100 μg/ml), poly(C) (7 μg/ml), and fetuin (100 μg/ml). Results shown are means ± standard errors of three independent determinations.

