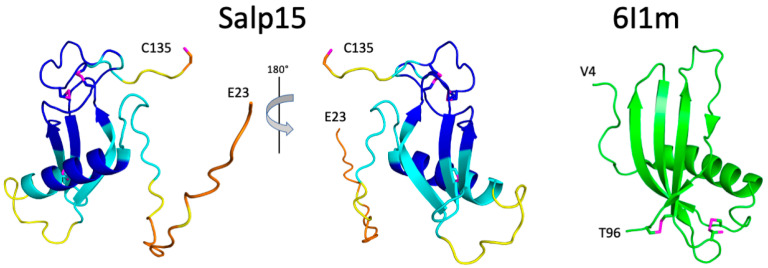
Figure 3.
Structural model of Salp15 and similarity with Protein Data Bank entry 6I1m. (Left) AlphaFold predicted structure for residues 23–135 of Salp15. The color code of the main chain follows that used by AlphaFold to report the reliability of the models. Blue, cyan, yellow, and orange protein regions correspond to very high (LDDT > 90), high (90 > LDDT > 70), low (70 > LDDT > 50), and very low (LDDT < 50) model confidence, respectively. The side chains of the seven cysteine residues are shown as sticks, with the sulfur atoms in magenta. Only the C-terminal C135 side chain is reduced (according to NMR chemical shifts). The depicted secondary structure is that identified by DSSP. (Right) Crystal structure of secreted type 1 cystatin from F. hepatica. The side chains of the four cysteines are shown in sticks with the sulfur atom in magenta. C66 is modeled in two conformations (both are shown). The depicted secondary structure is that identified by PyMol. The N- and C-terminal residues are indicated for both proteins.

