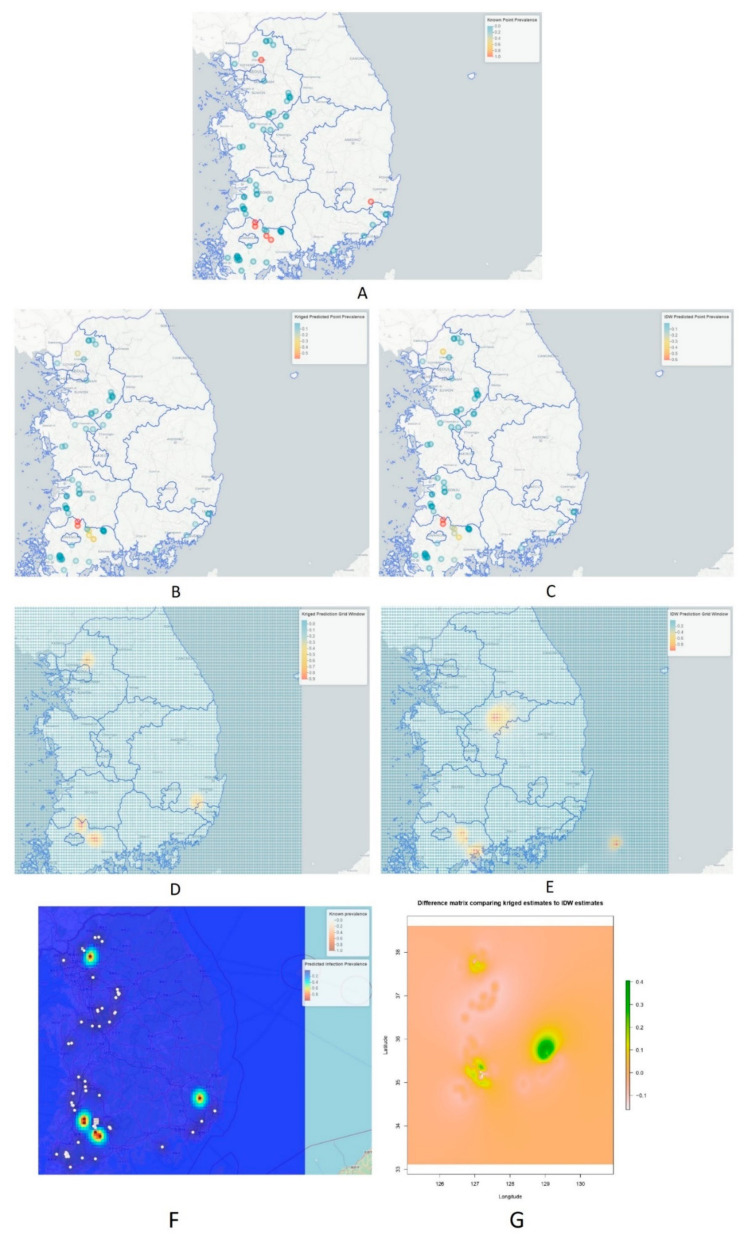
Figure 7.
Showing the point prevalence rate of HPAI H5N8 during 2nd phase, also depicting risk predictions based on kriging and IDW methods. (A) Known point prevalence rate during second phase of HPAI H5N8 epidemic. (B) Kriged prediction from the points where data were collected. (C) IDW predictions from the points of collected data. (D) Kriged prediction for the whole prediction grid window. (E) IDW prediction for the whole prediction grid window. (F) Comparison of known prevalence and kriged predicted prevalence with scale bar on the upper right corner. (G) The difference between using IDW versus kriging to interpolate our point prevalence data. Regions of greatest difference are indicated in green.

