Figure 7.

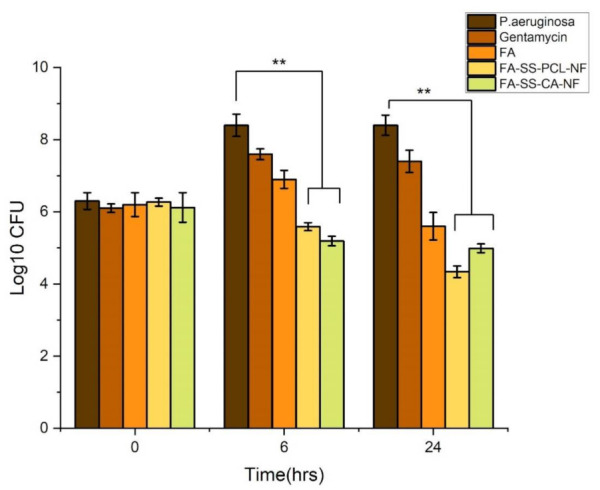
Bar graph of time-kill assay results against Pseudomonas aeruginosa. The error bars indicate the mean ± S.D. ** Significant differences between control, drug, and the formulations corresponding to bacteria.

Bar graph of time-kill assay results against Pseudomonas aeruginosa. The error bars indicate the mean ± S.D. ** Significant differences between control, drug, and the formulations corresponding to bacteria.