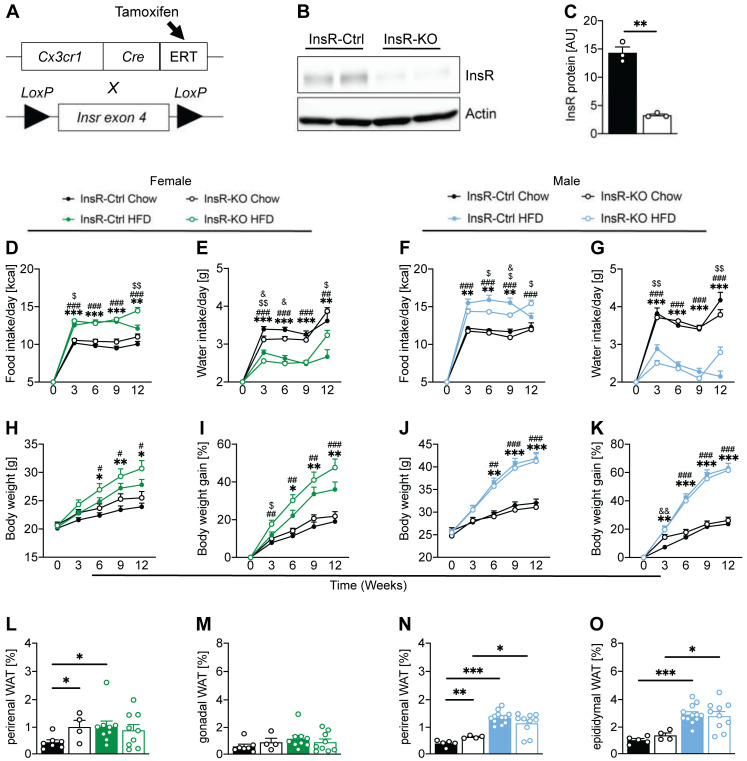
Figure 1.
Lack of microglial InsR alters the phenotypic progression of obesity in both male and female mice. (A) Schematic representation of the Cre/loxP animal model used in this study. (B) Western blot and (C) quantification of InsR in primary microglia of InsR-Ctrl (n = 3) and InsR-KO (n = 3) mice, following 4-hydroxytamoxifen treatment. There was a significant decrease of InsR protein in InsR-KO microglia, compared to InsR-Ctrl microglia; (D,E) Female InsR-Ctrl and InsR-KO mice fed a Chow (black) or HFD (green) data for (D) food intake and (E) water intake during 12 weeks of diet exposure (n = 10–25); (F,G) Male InsR-Ctrl and InsR-KO mice fed a Chow (black) or HFD (blue) data for (F) food intake and (G) water intake during 12 weeks of diet exposure (n = 16–27). Female HFD-fed InsR-KOs had higher caloric intake after 3 weeks of HFD, compared to InsR-Ctrls, while male InsR-KO had lower caloric intake after 6 and 9 weeks of HFD, compared to InsR-Ctrls; (H,I) Female InsR-Ctrl and InsR-KO mice fed a Chow diet (black) or HFD (green) data for (H) body weight and (I) body weight gain presented in percentage, during 12 weeks of diet exposure (n = 10–25); (J,K) Male InsR-Ctrl and InsR-KO mice fed a Chow (black) or HFD (blue) data for (J) body weight and (K) body weight gain presented in percentage, during 12 weeks of diet exposure (n = 16–27); (L,M) Female InsR-Ctrl and InsR-KO mice fed a Chow diet (black) or HFD (green) data for (L) perirenal and (M) gonadal white adipose tissue (WAT) presented as percentage of body weight upon sacrifice at week 12 of diet exposure (n = 5–9). Perirenal WAT was higher in InsR-Ctrl HFD and InsR-KO Chow, compared to InsR-Ctrl Chow mice; (N,O) Male InsR-Ctrl and InsR-KO mice fed a Chow (black) or HFD (blue) data for (N) perirenal and (O) epididymal white adipose tissue presented as percentage of body weight upon sacrifice at week 12 of diet exposure (n = 4–12). Perirenal WAT was higher in Ins-KO compared to InsR-Ctrl male mice on the Chow diet. Data are presented as mean ± SEM *, #, $, & p < 0.05; **, ##, $$ p < 0.01; ***, ### p < 0.0001. Symbols used to show significance between groups in (D-K): * InsR-Ctrl: Chow vs. HFD; # InsR-KO: Chow vs. HFD; & Chow: InsR-Ctrl vs. InsR-KO; $ HFD: InsR-Ctrl vs. InsR-KO.

