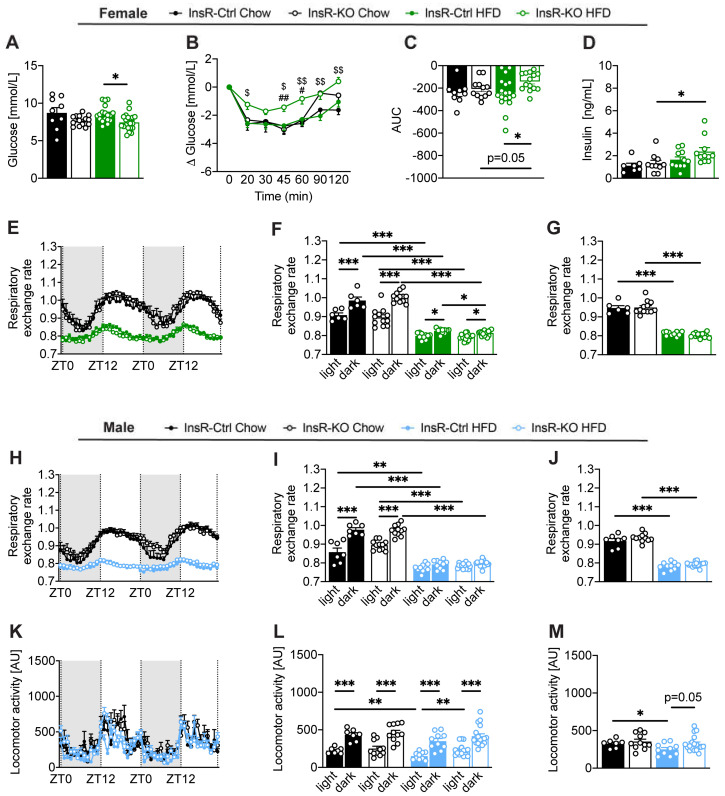
Figure 2.
Loss of microglial InsR leads to impaired glucose homeostasis in obese female mice. (A–D) Female InsR-Ctrl and InsR-KO mice fed a Chow diet (black) or HFD (green) data for (A) fasted blood glucose, following 11 weeks of diet exposure (n = 9–19). InsR-KO female mice had lower blood glucose compared to InsR-Ctrl mice during obesity. (B,C) insulin tolerance glucose concentration presented as (B) delta glucose and (C) AUC data (n = 9–19). Delta glucose and AUC in InsR-KO females were higher compared to InsR-Ctrl mice during obesogenic conditions; (D) fasted plasma insulin, following 11–12 weeks of diet exposure (n = 7–11); (E–G) Female InsR-Ctrl and InsR-KO mice fed a Chow diet (black) or HFD (green) data for the respiratory exchange rate (RER) presented as (E) 48 h plot, (F) 48 h light and dark phase and (G) 24 h (n = 6–16). Loss of microglial InsR led to lower RER during the dark phase in obesogenic condition; (H–J) Male InsR-Ctrl and InsR-KO mice fed a Chow diet (black) or HFD (blue) data for respiratory exchange rate presented as (H) 48 h plot, (I) 48 h light and dark phase and (J) 24 h (n = 7–18). (K–M) Locomotor activity data presented as (K) 48 h plot, (L) 48 h light and dark phase, and (M) 24 h (n = 7–18). InsR-KO male mice had higher locomotor activity during the light phase compared to InsR-Ctrl mice during obesogenic conditions. RER and locomotor activity data are measured at approximately 11 weeks of diet exposure for the duration of 48 h. Data are presented as mean ± SEM. *, #, $ p < 0.05; **, ##, $$ p < 0.01; *** p < 0.0001. Symbols used to show significance between groups in (B): # InsR-KO: Chow vs. HFD; $ HFD: InsR-Ctrl vs. InsR-KO.

