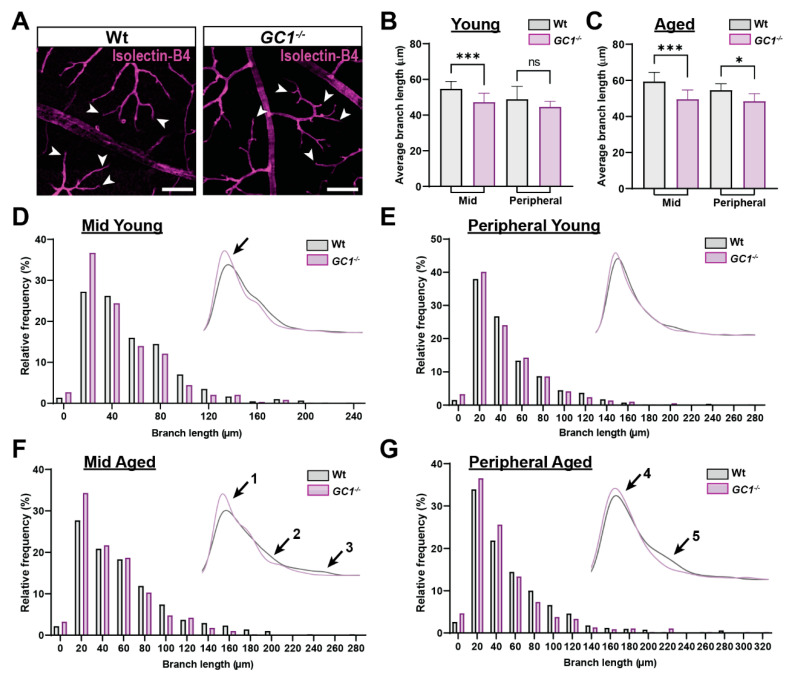
Figure 2.
GC1−/− mice have an increased frequency of shorter capillary branches compared to Wt mice. (A) Representative fluorescent images of Wt and GC1−/− vessels stained with isolectin-B4. White arrows give example of a selection of terminal vessels, scale bar = 100 µm. (B) In mid retina of young mice, average branch length was significantly shorter in GC1−/− mice compared with age-matched Wt mice. No significant difference was observed in the peripheral retina between genotypes (n = 6 mice per genotype group; *** p = 0.0002 and p = 0.46). (C) In mid retina of aged mice, average branch length was significantly shorter in GC1−/− mice compared with age-matched Wt mice (n = 3 mice per genotype group; *** p = 0.0051). Average branch length in the peripheral retina of aged GC1−/− mice was significantly shorter than in aged Wt mice (n = 3 mice per genotype group; * p = 0.022). (D) Histogram showing normalized frequency of branch lengths in the mid retina of young Wt and GC1−/− mice; inset: Kernel density estimation (KDE) plot. (E) Histogram showing normalized frequency of branch lengths in the peripheral retina of young Wt and GC1−/− mice; inset: KDE plot. (F) Histogram showing normalized frequency of branch lengths in the mid retina of aged Wt and GC1−/− mice; inset: KDE plot. There is an increase in the frequency of shorter vessel lengths (arrow 1) and a decreased frequency of longer vessel lengths in GC1−/− mice (arrows 2 and 3). (G) Histogram showing normalized frequency of branch lengths in the peripheral retina of aged Wt and GC1−/− mice; inset: KDE plot. The frequency of shorter branch lengths was increased in GC1−/− mice (arrow 4) compared with Wt and a lower frequency of longer branch lengths was observed in GC1−/− mice (arrow 5). Data are presented as means ± S.D. Statistical analyses carried out were Kruskal–Wallis one-way ANOVA. ns: not significant.

