Figure 5.
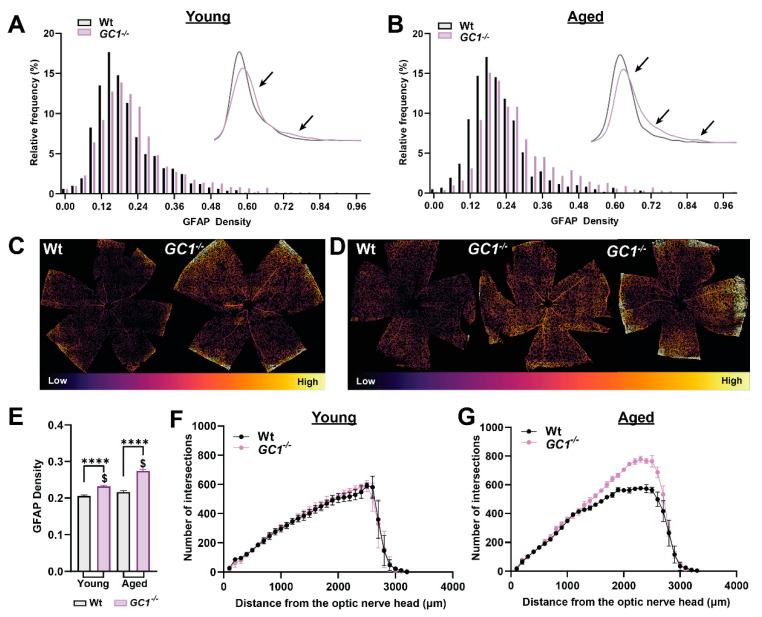
Astrocyte density is increased in GC1−/− retina. (A) Histogram plots of GFAP density across whole retinas of young Wt and GC1−/− animals (n = 8 Wt, n = 10 GC1−/−). The subplot shows a kernel density estimation plot for clarity; arrows signify differences in distributions between genotypes. (B) Histogram plots of GFAP density across whole retinas of aged Wt and GC1−/− animals (n = 3 Wt, n = 4 GC1−/−). The subplot shows a kernel density estimation plot for clarity; arrows signify differences in distributions between genotypes. (C) Representative retinas of young Wt and GC1−/− mice recolored according to relative GFAP density. (D) Representative retinas of aged Wt and GC1−/− mice pseudo-colored according to relative GFAP density; arrows point to areas of increased density. (E) Bar plot comparing GFAP densities between all groups. Data plotted as mean ± SEM. (**** p < 0.0001 and $ p < 0.0001). (F) Scholl analysis of binarized GFAP in young mice and (G) aged mice. Statistical analysis carried out was Kruskal–Wallis one-way ANOVA.

