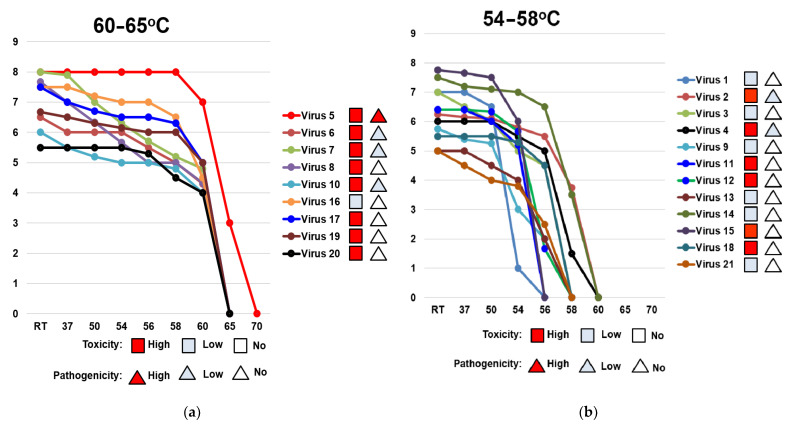
Figure 3.
Comparison of the dynamic of losses of thermal stability of the hemagglutinin of A(H1N1)pdm09 viruses circulating in 2009–2020. HA activity temperature threshold is (a) 60–65 °C (high thermal stability); (b) 54–58 °C (low thermal stability). RT—room temperature. X-axis—temperature (°C). Y-axis—log2 HA titer. Virus 1—A/California/07/2009; virus 2—A/Bolivia/559/2013; virus 3—A/Mississippi/10/2013; virus 4—A/New Hampshire/04/2013; virus 5—A/South Africa/3626/2013; virus 6—A/Florida/62/2014; virus 7—A/Laos/1187/2014; virus 8—A/New York/61/2015; virus 9—A/Slovenia/2903/2015; virus 10—A/Bangladesh/3002/2015; virus 11—A/Newcastle/67/2017; virus 12—A/South Australia/272/2017; virus 13—A/New Jersey/13/2018; virus 14—A/Darwin/123/2018; virus 15—A/Brisbane/02/2018; virus 16—A/lowa/59/2018; virus 17—A/lowa/12/2019; virus 18—A/Victoria/2570/2019; virus 19—A/Guangdong-Maonan/SWL1536/2019; virus 20—A/Arkansas/08/2020; virus 21—A/Indiana/02/2020. The red square indicates a strain of high toxicity. The red triangle indicates strain of high pathogenicity. The pale blue square indicates a strain of low or no toxicity. The pale blue triangle indicates strain of low or no pathogenicity.

