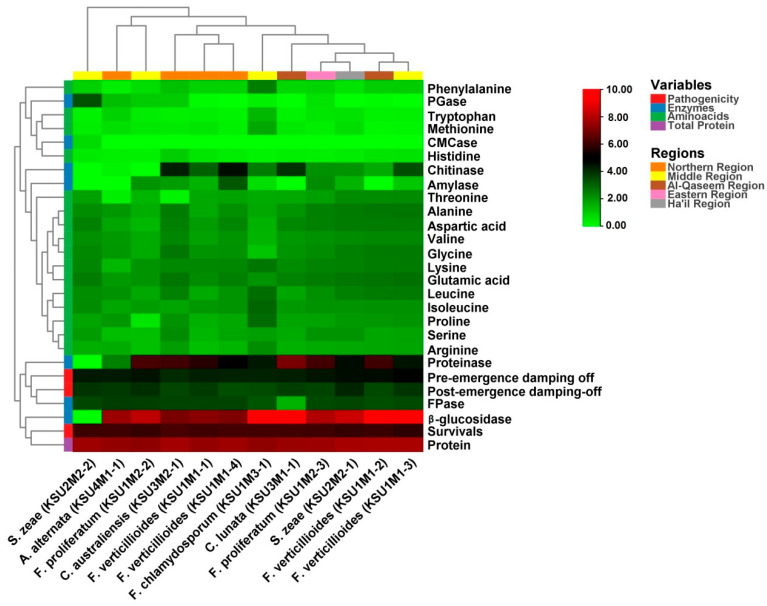
Figure 3.
Heatmap showing the correlation between the biophysiological and metabolic parameters and the phylogenetic relationship among the twelve pathogenic fungi of maize in KSA. The pathogenic fungi collected from five regions are indicated by the upper bar in 5 colors, whereas the biophysiological parameters are indicated by 4 variables (enzymes, amino acids, pathogenicity, and total protein) by the left bar with 4 colors. The color scale denotes the variable level increasing from zero (deep green) to 10 (deep red).

