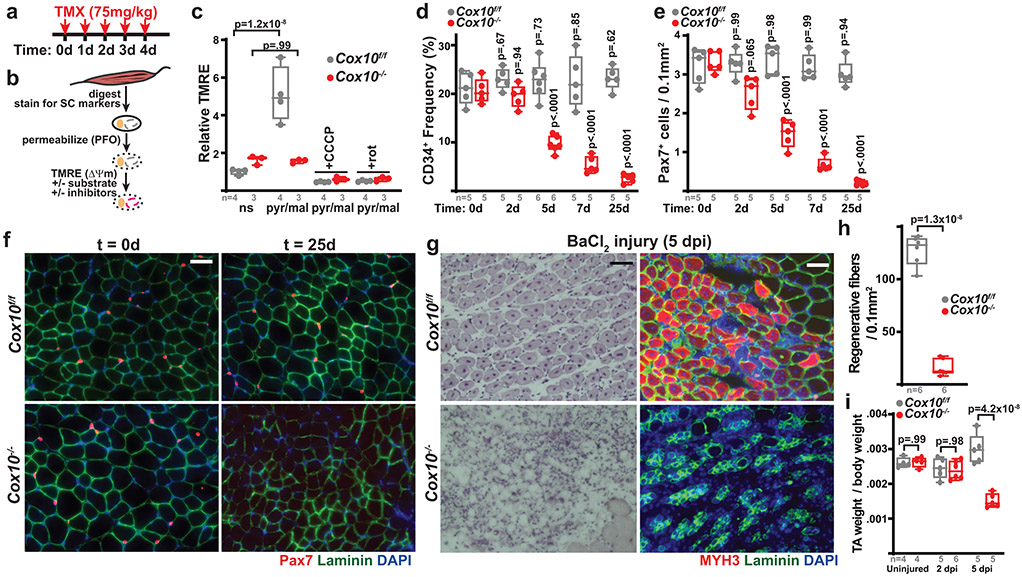
Fig. 1: Complex IV dysfunction induces rapid MuSC depletion in vivo.
a, Schematic for tamoxifen (TMX) administration protocol to induce recombination in adult MuSCs. b, FACS-based assay for ETC function: Isolated MuSCs are permeabilized with perfringolysin O (PFO), followed by TMRE staining in the presence or absence of mitochondrial substrates and inhibitors. c, Mean TMRE fluorescence of wild-type (Cox10f/f) and Cox10−/− MuSCs, in response to indicated substrates and inhibitors. ns, no substrate; pyr/mal, pyruvate/malate; rot, rotenone. d, MuSC frequency at indicated timepoints after the 1st dose of tamoxifen in mice with Cox10f/f or Cox10−/− MuSCs. p-values reflect comparisons with t=0 day data for each genotype. e, Pax7+ cell numbers (normalized to muscle area) at different times post the 1st dose of tamoxifen. p-values reflect comparisons with t=0 day data for each genotype. f, Representative images of endogenous Pax7+ cells (red), Laminin (green) and DAPI (blue) from tibialis anterior (TA) cross-sections of indicated mice at different times post-tamoxifen administration. Scale bar, 50 μm. g, Histology (H&E staining) and immunofluorescence images of TA cross-sections at 5 days post-BaCl2 injury (dpi). Regenerative myofibers can be identified by their centrally localized nuclei and MYH3-positive staining at this timepoint. Scale bar, 50 μm. h, Quantitation of regenerative (central nuclei) myofibers (normalized to muscle area) in TA muscles at 5 days post-BaCl2 injury. i, TA weight (normalized to body weight) at various time points after BaCl2 injury. dpi, days post-injury. Statistical significance was assessed using two-way ANOVA (c,d,e,i), or two-tailed t-test (h), tests with adjustments for multiple comparisons. Box plots indicate median values and interquartile ranges; whiskers are plotted using the Tukey method. The number of biological replicates in each group and p-values are indicated in the figure. Experiments were repeated 5 times in panel f, and 6 times in panel g; both with similar results.

