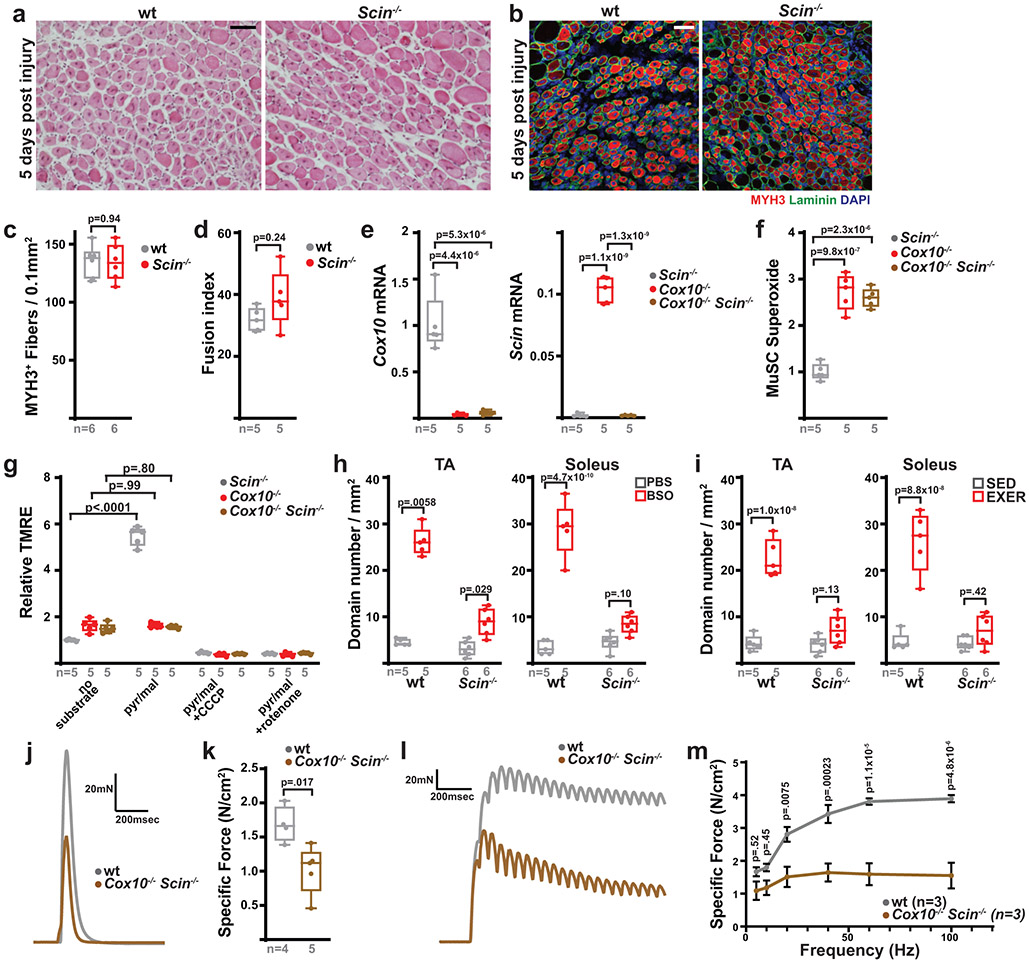
Extended Data Figure 8: Scinderin is required for MuSC-myofiber fusion.
a, Histology (H&E) from TA cross-sections at 5 days post BaCl2 injury. b, Immunofluorescence of TA cross-sections, 5 days post BaCl2 injury, stained for MYH3 (red), Laminin (green), and DAPI (blue). c, MYH3+ regenerative myofibers (normalized to muscle area) at 5 days post BaCl2 injury. d, Fusion indices in MuSCs subjected to in vitro differentiation. e, Cox10 and Scin transcript levels (normalized to β2-microglobulin) in MuSCs at 5 days post 1st tamoxifen dose. f, MuSC superoxide levels at 5 days post 1st tamoxifen dose. g, Mean MuSC TMRE fluorescence in the indicated conditions. pyr/mal, pyruvate/malate. h, mito-Dendra2 domain numbers (normalized to muscle area) in muscle of PBS or BSO-treated mice (for 21 days). i, mito-Dendra2 domain numbers (normalized to muscle area) in muscle of sedentary (SED) or exercised (EXE) mice. j, Representative traces of maximal twitch force from TA muscle at 21 days post-BaCl2 injury. k, Specific force for maximal twitch from TA muscles at 21 days post-BaCl2 injury. l, Representative traces of tetanic force generation from TA muscles (at 21 days post-BaCl2 injury) subjected to a 20Hz stimulus. m, Force-frequency relationship from TA muscles at 21 days post-BaCl2 injury. Statistical significance was assessed using two-tailed t-test (c,d,k), Kruskal-Wallis (h), one-way ANOVA (e,f), or two-way ANOVA (g,h,i,m) tests, with adjustments for multiple comparisons. Box plots indicate median values and interquartile ranges; whiskers are plotted using the Tukey method. The number of biological replicates per group is indicated. All scale bars are 50 μm. Experiments were repeated 3x (panel a), 6x (panel b); all with similar results.

