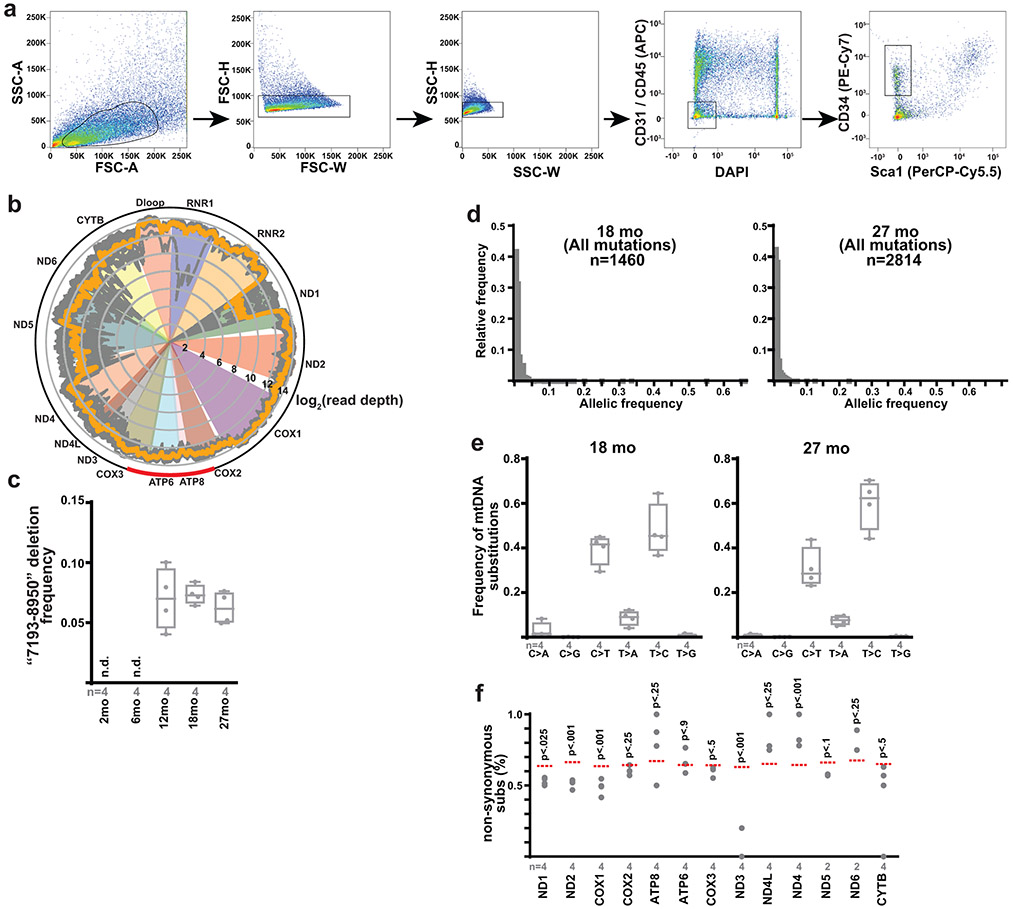
Extended Data Figure 9: Aging MuSCs accumulate mtDNA mutations.
a, Representative images for FACS isolation of murine MuSCs. Cells were first gated by forward scatter (FSC) and side scatter (SSC) to remove doublets. MuSCs were identified by negative gating for DAPI, CD31, CD45, Sca1, and positive gating for CD34. b, Read depth across the mitochondrial genome for all samples (gray traces), displayed using a log2 scale. Average read depth for all samples shown in orange. The red arc indicates the position of the common “7193-8950” deletion. c, Deletion frequency of the “7193-8950” deletion detected in MuSCs from mice of the indicated age. n.d, not detected. d, Histogram of allelic frequencies for all detected mtDNA mutations in MuSCs from 18 month old and 27 month old mice. The number of identified mutations is indicated. e, Mutational signature of mtDNA substitutions in MuSCs from 18 month old and 27 month old mice. f, The observed frequencies of non-synonymous substitutions in each mtDNA gene from isolated MuSCs of 27 month old mice. The expected frequency is indicated as the dashed red line. p-values are calculated from chi-squared test. Box plots indicate median values and interquartile ranges; whiskers are plotted using the Tukey method. The number of biological replicates per group is indicated in the figure.

