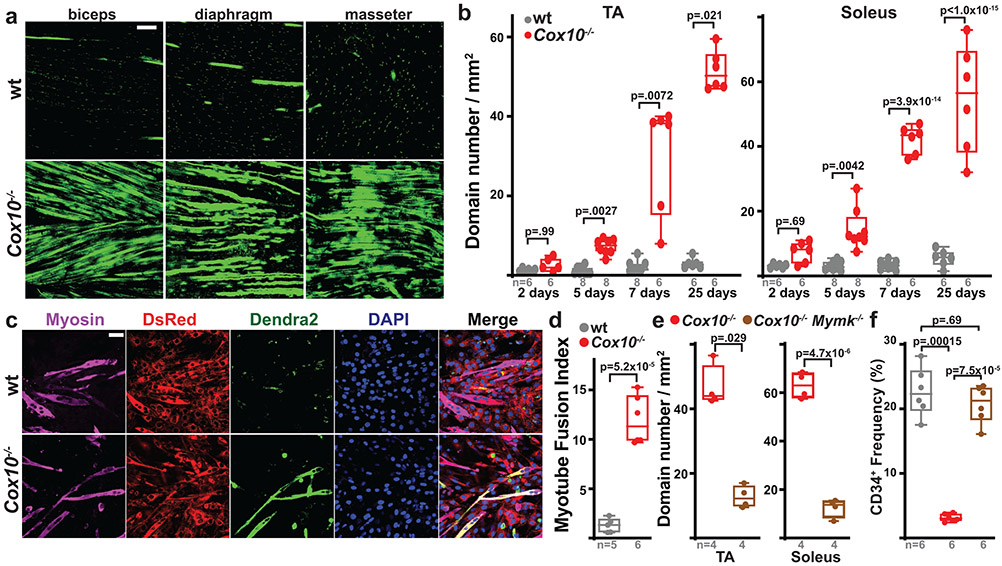
Fig. 2: Complex IV dysfunction induces MuSC-myofiber fusion in vivo and in vitro.
a, Longitudinal imaging of mito-Dendra2 signal in various muscles at 21 days post the 1st dose of tamoxifen. Scale bar, 200 μm. b, mito-Dendra2 domain number (normalized to muscle area) in myofibers of TA and soleus muscles at different times post the 1st dose of tamoxifen. c, In vitro MuSC-myotube fusion assay: Dendra2+ (green) freshly-isolated MuSCs of the indicated genotype were overlaid on DsRed+ (red) C2C12 myotubes and assessed for fusion with Myosin+ (magenta) myotubes after 4 days. Cells were stained with Myosin (magenta) and DAPI (blue). Scale bar, 50 μm. d, Quantitated myotube fusion indices for MuSCs of the indicated genotype. e, mito-Dendra2 domain numbers in TA and soleus muscles at 21 days post the 1st dose of tamoxifen in mice of the indicated genotype. Mymk, Myomaker. f, MuSC (CD34+) frequency of the indicated genotypes at 21 days post the 1st dose of tamoxifen. Same color scheme as d,e. Statistical significance was assessed using two-way ANOVA (b), two-tailed t-test (d,e), Kruskal-Wallis (b), two-tailed Mann-Whitney (e), or one-way ANOVA (f) tests with adjustments for multiple comparisons. Box plots indicate median values and interquartile ranges; whiskers are plotted using the Tukey method. The number of biological replicates in each group and p-values are indicated in the figure. Experiments were repeated 3 times in panel a, and 5-6 times in panel c; both with similar results.

