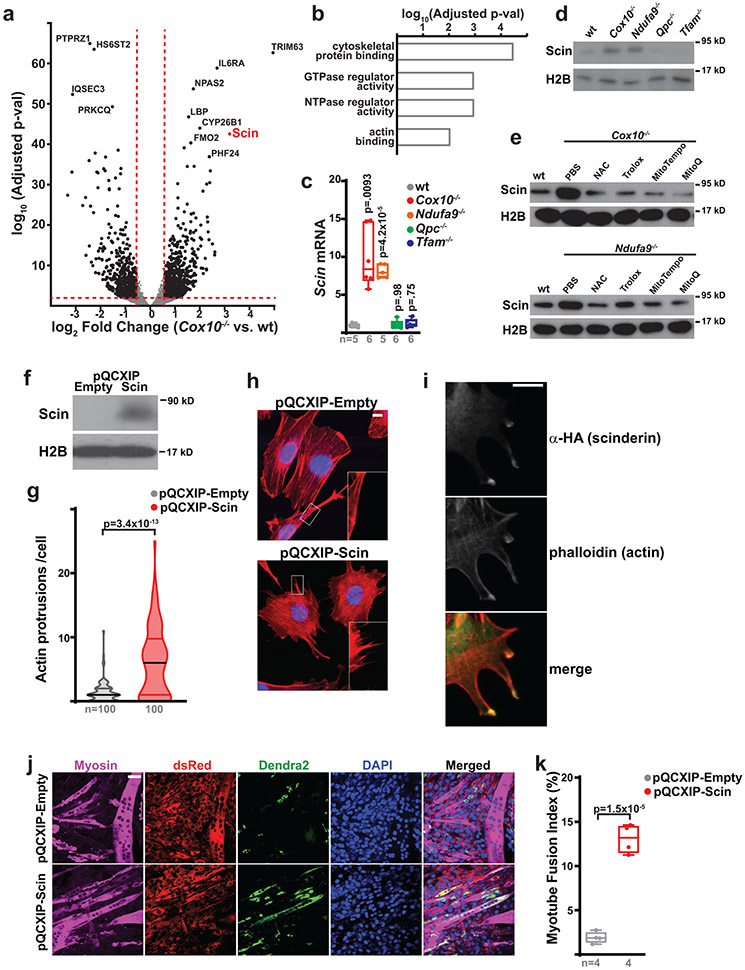
Fig. 4: Scinderin induces actin network changes and MuSC-myotube fusion.
a, Volcano plot of gene expression changes in Cox10−/− vs. wt MuSCs. Log2(Fold Change) is plotted against the log10(adjusted p-value) for each gene. b, Gene ontology analysis of upregulated genes in Cox10−/− MuSCs. c, Normalized Scinderin transcript levels in isolated MuSCs of the indicated genotype at 5 days post the 1st dose of tamoxifen. p-values reflect comparisons with the wt group. d, Scinderin protein levels in isolated MuSCs of the indicated genotype at 5 days after the 1st dose of tamoxifen. Histone 2B (H2B) levels are shown as a loading control. e, Scinderin protein levels in isolated MuSCs of the indicated genotype and treatment at 5 days post the 1st dose of tamoxifen. H2B levels are shown as a loading control. f, Scinderin protein levels in C2C12 cells infected with empty or Scinderin overexpressing virus. H2B levels are shown as a loading control. g, Violin plots of actin protrusion numbers (per cell) for control and Scinderin-overexpressing C2C12 cells. h, Representative images of actin networks (stained by Acti-stain555 phalloidin (red)) and nuclei (DAPI, blue) in control and Scinderin-overexpressing C2C12 cells. Scale bar, 10 μm. i, Scinderin (α-HA; green) and actin (phalloidin; red) localization in cells overexpressing Scinderin. Scale bar, 10 μm. j, Representative images from an in vitro MuSC-myotube fusion assay: 10,000 Dendra2+ (green) freshly-isolated control or Scin-overexpressing MuSCs were overlaid on DsRed+ (red) C2C12 myotubes and assessed for fusion with Myosin+ myotubes after 4 days. Cells were stained with Myosin (magenta) and DAPI (blue). Scale bar, 50 μm. k, Quantitated myotube fusion indices for MuSCs of the indicated genotype. Statistical significance was assessed using one-way ANOVA (c), two-tailed Mann-Whitney test (g) or two-tailed t-test (k). Box and violin plots indicate median values and interquartile ranges; whiskers are plotted using the Tukey method. The number of biological replicates per group and p-values are indicated in the figure. Experiments were repeated 3 times in panels h,i, and 4 times in panel j; all with similar results.

