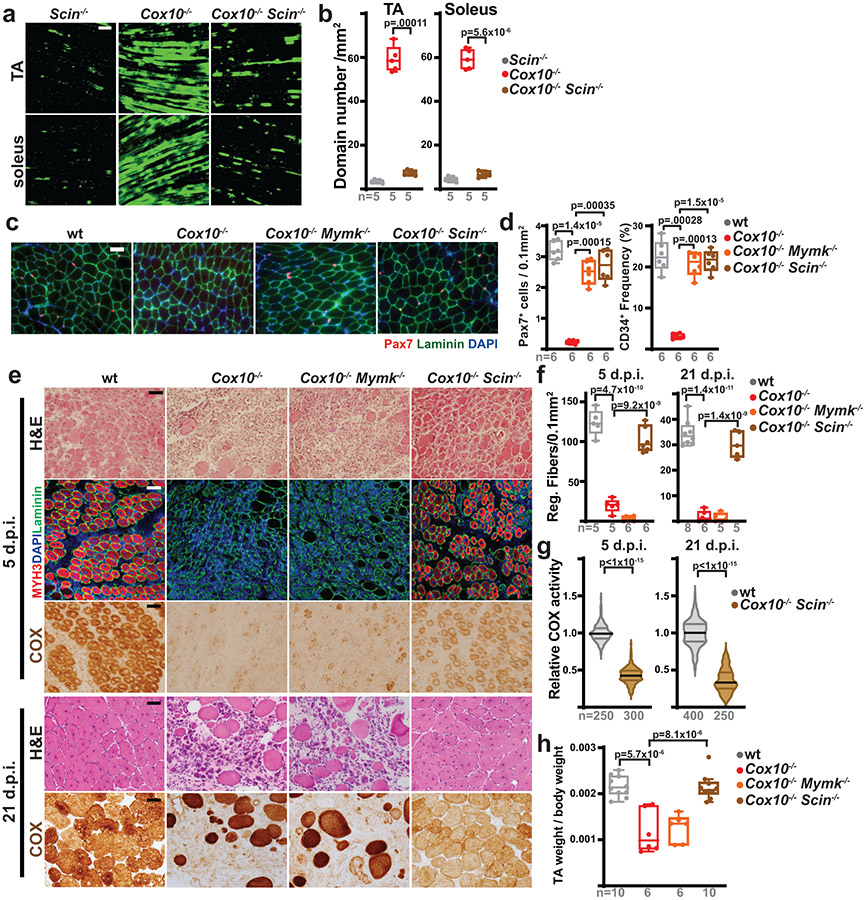
Fig. 5: Scinderin is required for MuSC-myofiber fusion.
a, Representative longitudinal images of mito-Dendra2 domains in TA and soleus muscles of mice of the indicated genotype, 21 days post the 1st dose of tamoxifen. Scale bar, 200 μm. b, mito-Dendra2 domain numbers (normalized to muscle area) at 21 days post the 1st dose of tamoxifen. c, Representative images of endogenous Pax7+ cells (red), laminin (green) and DAPI (blue) from tibialis anterior (TA) cross-sections from mice of the indicated genotype at 21 days post the 1st dose of tamoxifen. Scale bar, 50 μm. d, MuSC (CD34+) and Pax7+ frequency in mice of the indicated genotype at 21 days post the 1st dose of tamoxifen. e, Representative images of histology (H&E), MYH3+ fibers (red) and complex IV activity (COX) in cross-sections of TA muscles from mice of the indicated genotypes. Muscles were harvested and assessed 5 days or 21 days post-BaCl2 injury. For immunofluorescent staining, sections were stained with α-laminin (green), α-MYH3 (red), and DAPI (blue). Scale bar: 50 μm. d.p.i, days post-injury. f, Quantitation of regenerative fiber numbers (normalized to muscle area) in TA muscles at 5 days and 21 days post-BaCl2 injury. g, Normalized COX activity from regenerative myofibers at 5 days and 21 days post-BaCl2 injury. The number of analyzed fibers per group is indicated. h, TA weight (normalized to body weight) at 21 days after BaCl2 injury. Statistical significance was assessed using one-way ANOVA (b,d,f,h) or two-tailed Mann-Whitney (g) tests, with adjustments for multiple comparisons. Box and violin plots indicate median values and interquartile ranges; whiskers are plotted using the Tukey method. The number of biological replicates in each group and p-values are indicated in the figure. Experiments were repeated 5 times for panel a, 6 times for panel c, and 5-8 times for panel e; all with similar results.

