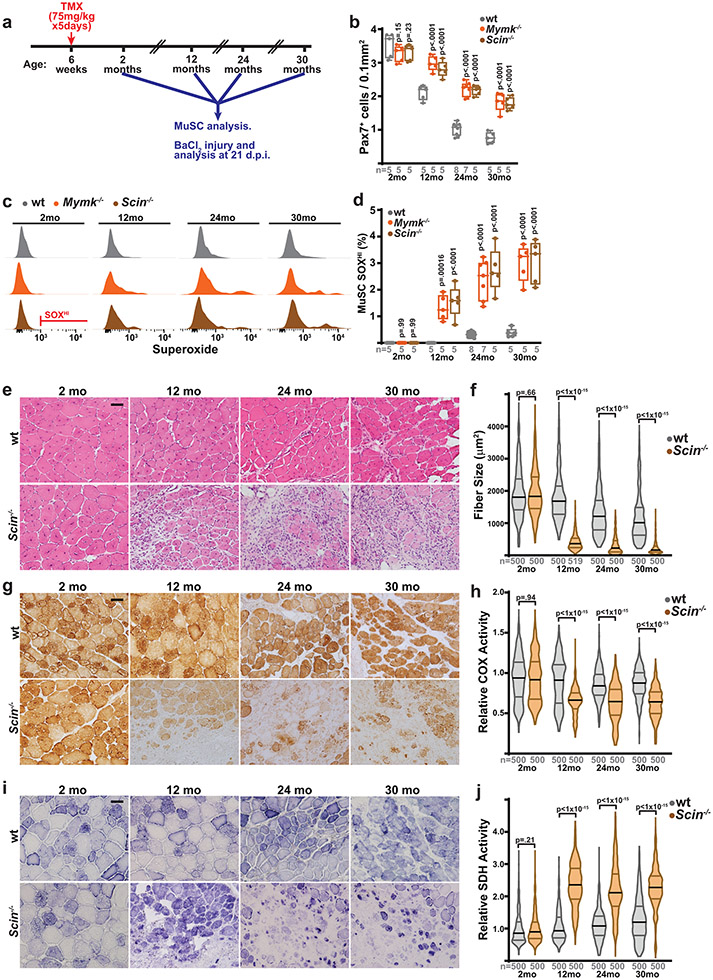
Fig. 7: Scinderin is required for regenerating healthy tissue in aged animals.
a, Schematic of aging experiments in wild-type, Mymk−/− and Scin−/− mice. Recombination is induced in MuSCs of animals at 6 weeks of age via tamoxifen (TMX) administration, followed by aging and the indicated analysis at various timepoints (2, 12, 24 and 30 months of age). At each timepoint, MuSCs are analyzed in situ and by FACS; in addition, tibialis anterior (TA) muscles are injured by BaCl2 and assess for regeneration at 21 days post-injury (d.p.i.). b, Pax7+ cell numbers (normalized to muscle area) in animals of the indicated genotype and age. p-values represent comparison with wt for each age group. c, Representative FACS profiles of Superoxide (SOX) levels in MuSCs isolated from animals of the indicated genotype and age. Gating for SOXHI population is indicated. d, Quantitation of SOXHI population frequency from MuSCs of mice of the indicated age and genotype. p-values represent comparison with wt for each age group. e, Representative images of histology (H&E) in cross-sections of TA muscles from mice of the indicated genotypes and ages. Muscles were harvested and assessed 21 days post-BaCl2 injury. Scale bar: 50 μm. f, Quantitation of fiber size from regenerative fibers (21 days post-injury) in TA muscles of mice of the indicated genotypes and ages. g, Representative images of COX activity in cross-sections of TA muscles from mice of the indicated genotypes and ages, at 21 days post-BaCl2 injury. h, Quantitation of relative COX activity in regenerative fibers (21 days post-injury) from TA muscles of mice of the indicated genotypes and ages. i, Representative images of SDH activity in cross-sections of TA muscles from mice of the indicated genotypes and ages, at 21 days post-BaCl2 injury. j, Quantitation of relative SDH activity in regenerative fibers (21 days post-injury) from TA muscles of mice of the indicated genotype and ages. Statistical significance was assessed using two-way ANOVA (b,d) or two-tailed Mann-Whitney (f,h,j) tests, with adjustments for multiple comparisons. Box and violin plots indicate median values and interquartile ranges; whiskers are plotted using the Tukey method. The number of biological replicates in each group and p-values are indicated in the figure. Experiments were repeated 5-8 times in in panels e,g,I; all with similar results.

