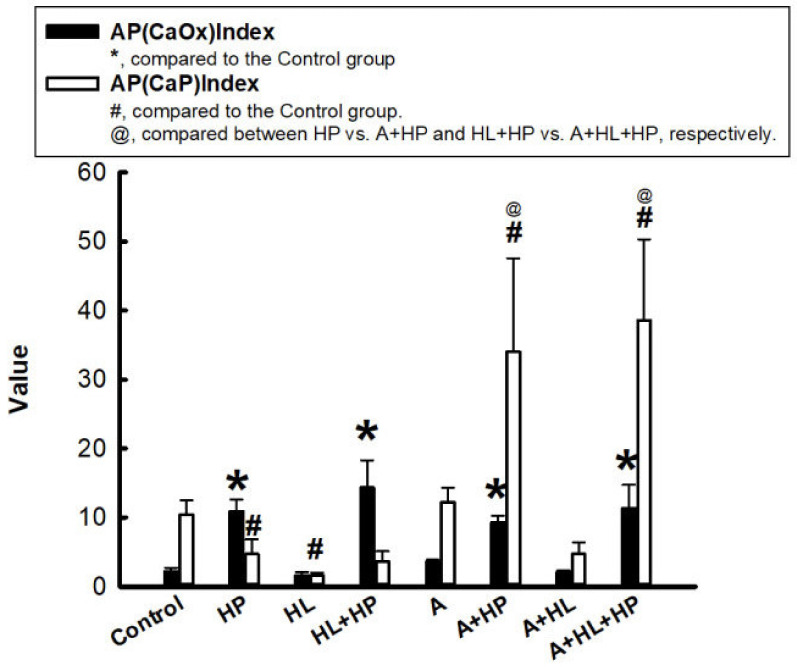
Figure 1.
Ion activity product of calcium oxalate (AP(CaOx)) and calcium phosphate (AP(CaP)). The black bar represents AP(CaOx), and the white bar represents AP(CaP). * p < 0.05 versus AP(CaOx) of the control group; # p < 0.05 versus AP(CaP) of the control group; @ p < 0.05 between with and without A in each subgroup (e.g., N vs. A).

