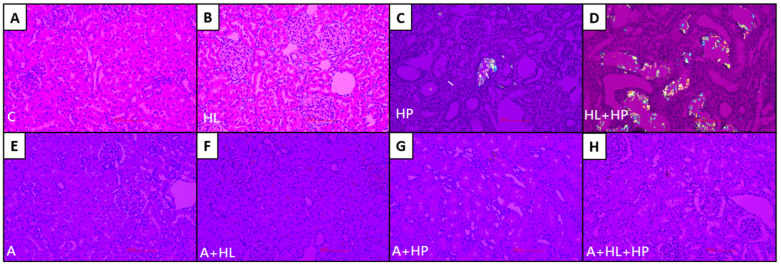
Figure 3.
Representative micrographs of renal cortex and medulla photographed using a polarized microscope. (A) Control. (B) Hyperlipidemia (HL). (C) Rats treated with 5% hydroxyproline (HP). (D) HL rats treated with 5% HP. (E) Controls treated with atorvastatin. (F) HL rats treated with atorvastatin. (G) Rats treated with 5% HP and atorvastatin. (H) HL rats treated with 5% HP and atorvastatin. All images above were demonstrated with original magnification 200×.

