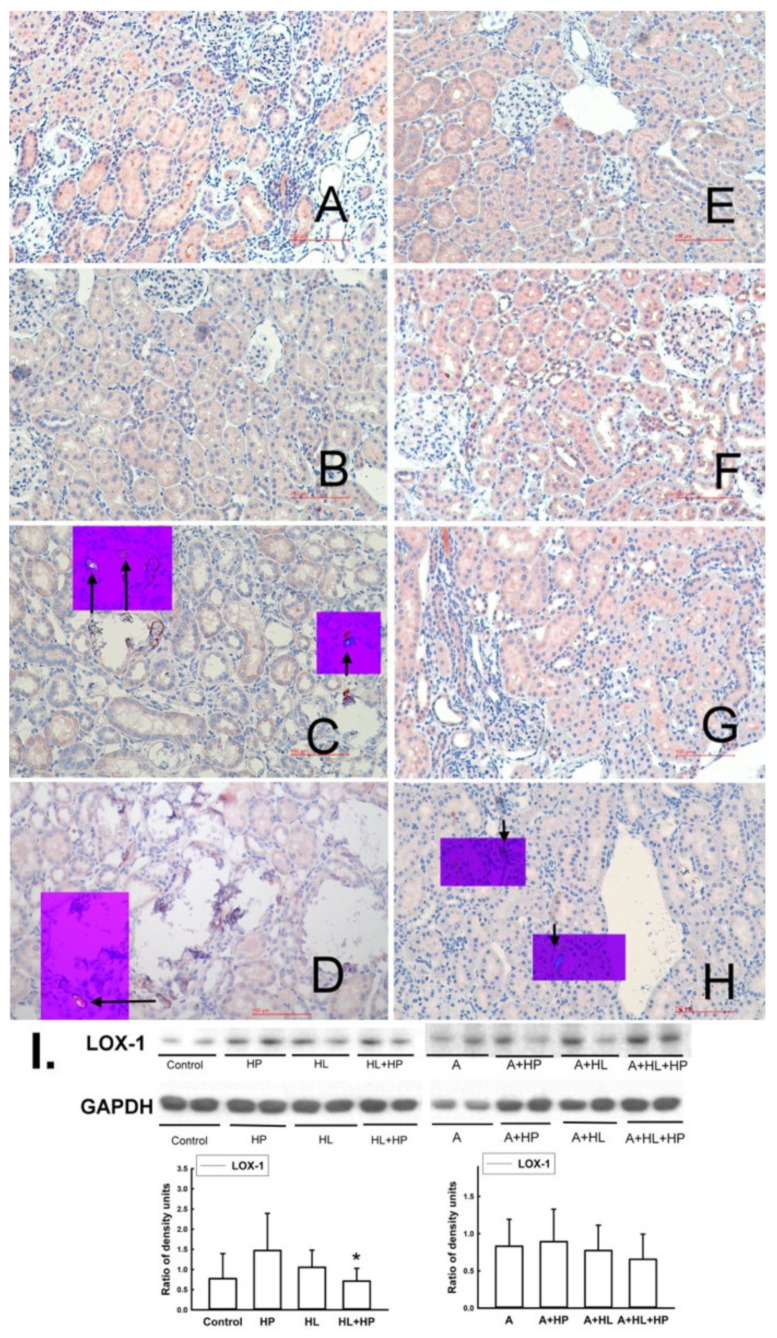
Figure 5.
Representative micrographs of renal sections stained for LOX-1 (oxidized LDL receptor), Reduced from × 200. The small purple box shows the same renal section which was examined by polarized microphotography (Reduced from × 200) to observe CaOx or CaP deposition (indicated by black arrows) in the kidney. Left panel: A–D: Non-A (Atorvastatin) experimental groups: (A) Control group. (B) Hyperlipidemia (HL). (C) Rats treated with 5% hydroxyproline (HP). (D) HL rats treated with 5% HP: LOX-1 level decreased significantly compared to the levels in the control group (p = 0.034) and the HP group (p = 0.026). Right panel: E–H: A-treated experimental groups: (E) A group. (F) A + HP group. (G) A + HL group. (H) A + HL + HP group. All images above were demonstrated with original magnification 400×. (I) The representative blots shown were obtained from two different rat kidneys. The histogram shows the relative density of the protein of interest with respect to GAPDH density for six animals in each groups. * p < 0.05 when compared to the age-matched corresponding HP group.

