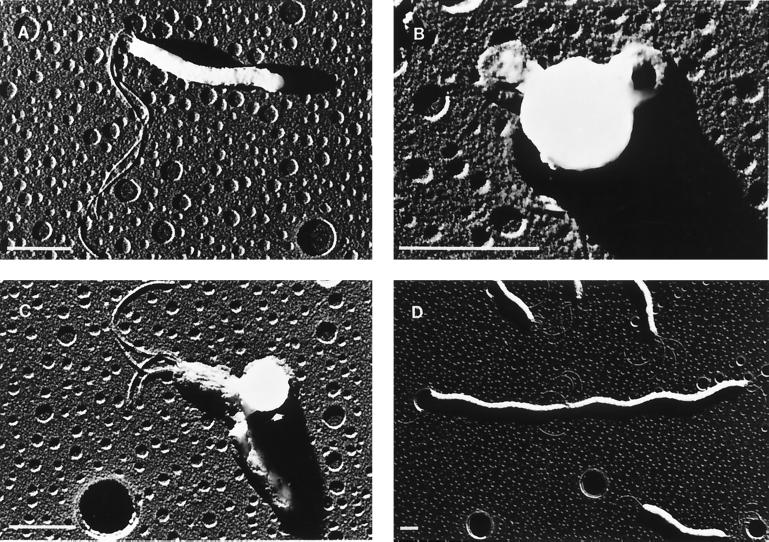
FIG. 4.
Transmission electron micrographs illustrating representative examples of log-phase H. pylori control bacteria (A), spherical cell formation typical of that seen after treatment with various β-lactam antibiotics (B), membrane blebbing (indicated by the arrowhead) seen after treatment with various β-lactam antibiotics (C), and significant filamentation, which was only observed in cultures exposed to sub-MICs of aztreonam (D). The bar in each graph represents 1 μm. Note that the spherical imperfections in the background are artifacts due to the formation of holes in the Formvar-coated support film.

