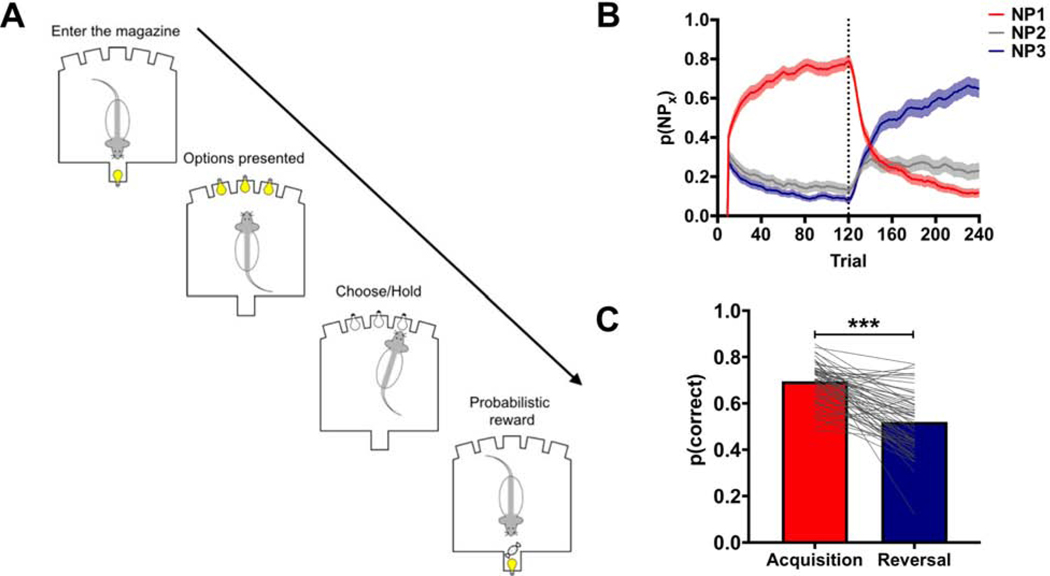
Figure 1:
The probabilistic reversal learning (PRL) task. (A) A diagram outlining the events of a single trial in the PRL task. (B) The choice behavior of rats in the PRL. Rats were able to acquire (red line) and reverse (blue line) their choices in the PRL using a 10-trial moving average. The gray line is the probability of rats choosing the noseport associated with an intermediate probability of reinforcement. (C) The probability of choosing the highest reinforced option was significantly lower following the reversal. *** p<0.001. Related to Supplemental Figure 1.

