Figure 2:
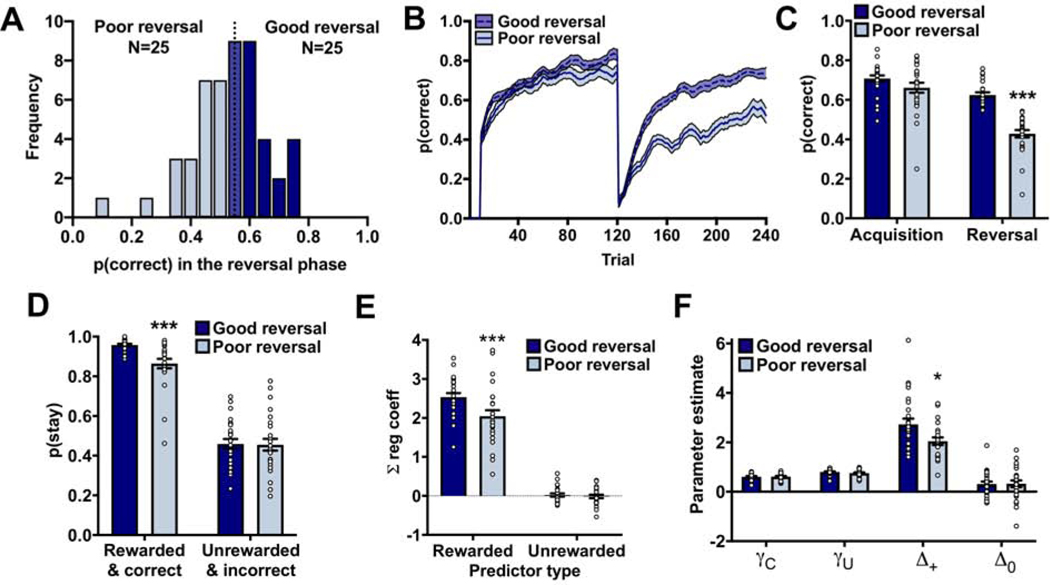
Differences in reversal performance are due to differences in action-value updating following positive feedback. (A) Frequency distribution of the performance of rats in the reversal phase. Rats were divided into two groups based on a mean-split: rats who chose the correct noseport with a probability greater than the group average (good reversal; dark bars; N=25) and rats who chose the correct noseport with a probability less than the group average (poor reversal; light bars; N=25). (B) The choice behavior of rats in the good and poor reversal group in the PRL using a 10-trial moving average. (C) Rats in the poor reversal group were able to acquire the initial discrimination, but had greater difficult following the reversal. (D) The poor reversal group were less likely to stay with a rewarded and correct response compared to the good reversal group. No group differences were observed in the probability that rats would stay with an unrewarded and incorrect response. (E) The logistic regression model containing a ‘Reward’ and ‘No reward’ predictor indicated that the poor reversal group were less likely to use positive feedback from recent trial history to guide their current choice compared to the good reversal group. No group differences were detected for the ‘No reward’ regression coefficients. (F) The reinforcement-learning algorithm indicated that the poor reversal group had a selective reduction in the Δ+, as no differences were detected in the other parameter estimates. * p<0.05; *** p<0.001. Related to Supplemental Figure 2.

