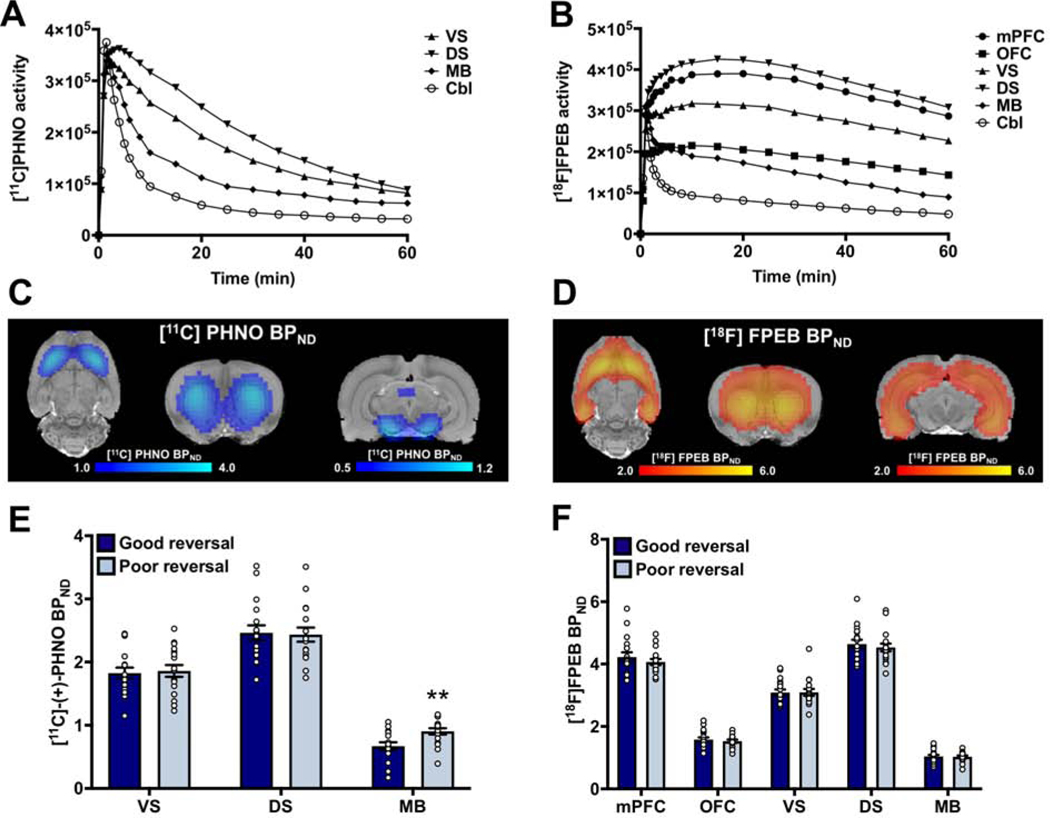
Figure 3:
Poor reversal performance is associated with higher midbrain D3 BPND. (A-B) Average time activity curves in the six regions of interest extracted from either (A) [11C]PHNO or (B) [18F]FPEB dynamic images. (C-D) Binding potential maps showing the distribution of (C) [11C]PHNO and (D) [18F]FPEB binding in the rat brain. (E) [11C]PHNO BPND in the midbrain was significantly greater in the poor reversal group compared to good reversal group. (F) No differences in [18F]FPEB BPND were observed between good and poor reversal groups. ** p<0.01; Abbreviations: mPFC – medial prefrontal cortex; OFC – orbitofrontal cortex; VS – ventral striatum; DS – dorsal striatum; MB – midbrain; Cbl – cerebellum.

