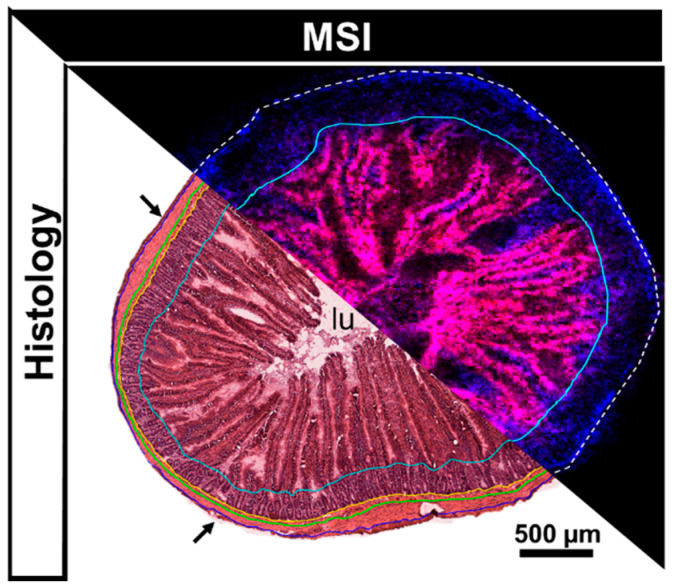
Figure 1.
Annotated H&E scan compared to combined ion image obtained from an adjacent tissue section analyzed by MALDI-MSI (endogenous lipids PC (34:2) [M+K]+ (m/z 796.53) (red) and PC (34:1) [M+K]+ (m/z 798.54) (blue). Histological annotation on the H&E stained tissue: arrows = serosa, outside blue line = outer muscularis, between blue and green line = inner muscularis, between green and yellow line = submucosa, between yellow and turquoise line = mucosal crypts, within turquoise line = mucosal villi and intestinal lumen (lu).

