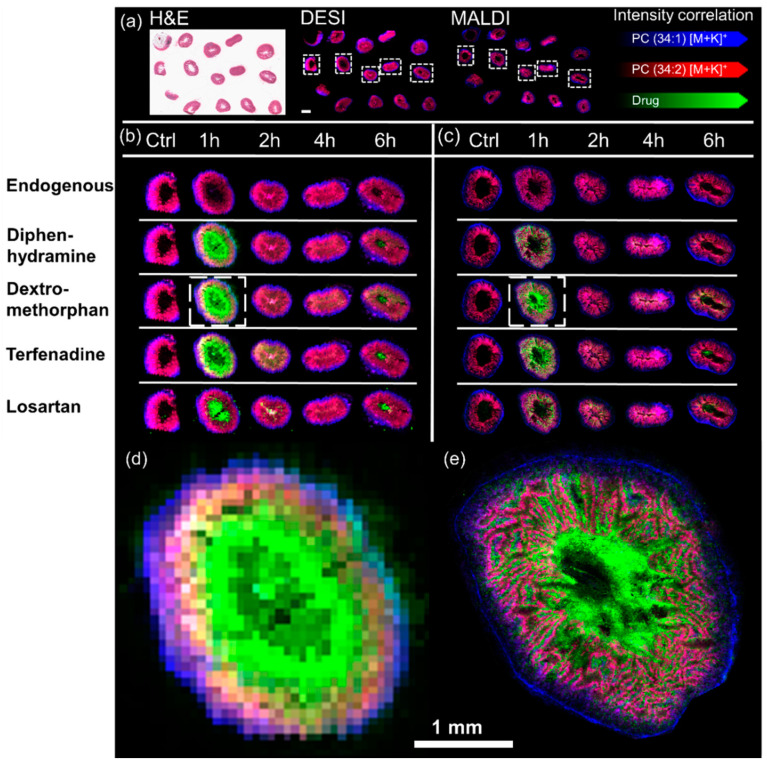
Figure 2.
Representative spatial distribution of the cassette dosed drugs determined by DESI-MSI and MALDI-MSI: (a) Panorama view on a whole post-DESI H&E stained slide (left) as it was analyzed in one experiment by DESI-MSI (middle) and MALDI-MSI (right). The scale bar in the DESI insert is 2 mm wide. The spatial distribution of all four dosed drugs is shown in one representative replicate for all timepoints in relation to endogenous species outlining the tissues. The left-hand side of the figure shows the results of (b) DESI-MSI experiments performed with a spatial resolution of 75 µm whilst the right-hand side of the figure shows the results of (c) MADI-MSI experiments acquired with a spatial resolution of 10 µm. The inserts (d,e) display the spatial distribution of dextromethorphan in the highlighted tissue sections in (b,c) respectively.

