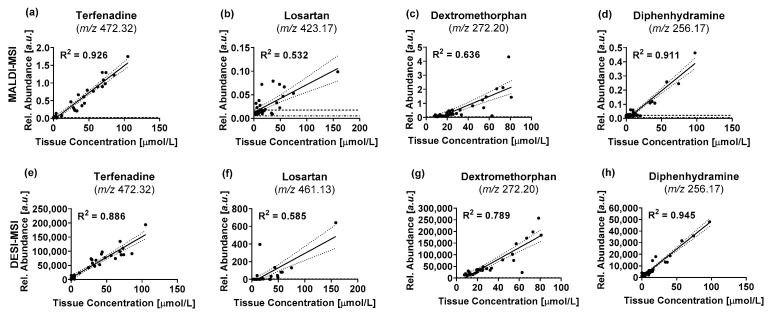
Figure 6.
Comparison of drug tissue concentrations (terfenadine (a,d), losartan (b,f), dextromethorphan (c,g), diphenhydramine (d,h)) determined by LC-MS/MS and MALDI-MSI (a–d) and DESI-MSI (e–h), respectively. Each datapoint describes the measured data for one of the three intestinal segments that were analyzed for each animal. Relative abundances for MSI data are represented by the mean abundance of the whole tissue section. — Indicate best-fit linear regression lines … indicate the 95% confidence interval of the regression lines -·- indicate the LOD for the respective MSI technique --- indicate the LLOQ for the respective imaging technique.

