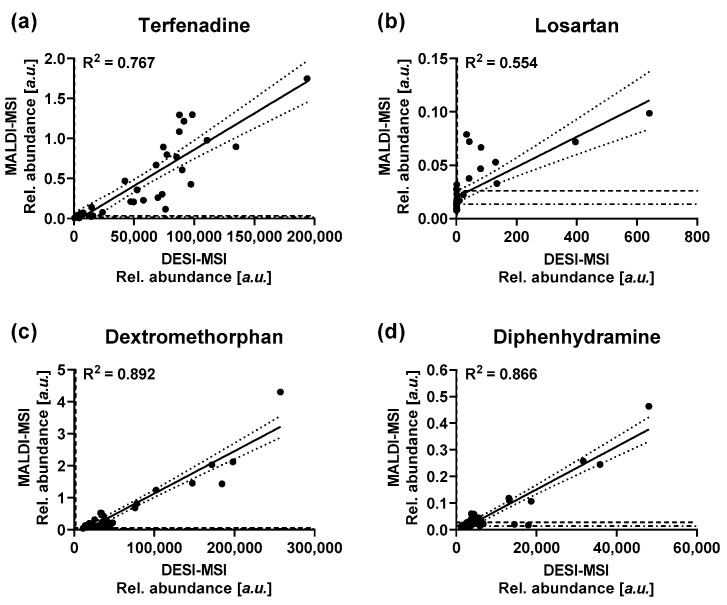
Figure 7.
Correlation of the average drug abundances as detected by DESI-MSI and MALDI-MSI for (a) terfenadine, (b) Losartan, (c) dextromethorphan and (d) diphenhydramine. — Indicate best-fit linear regression lines … indicate the 95% confidence interval of the regression lines -·- indicate the LOD for the respective MSI technique --- indicate the LLOQ for the respective imaging technique.

