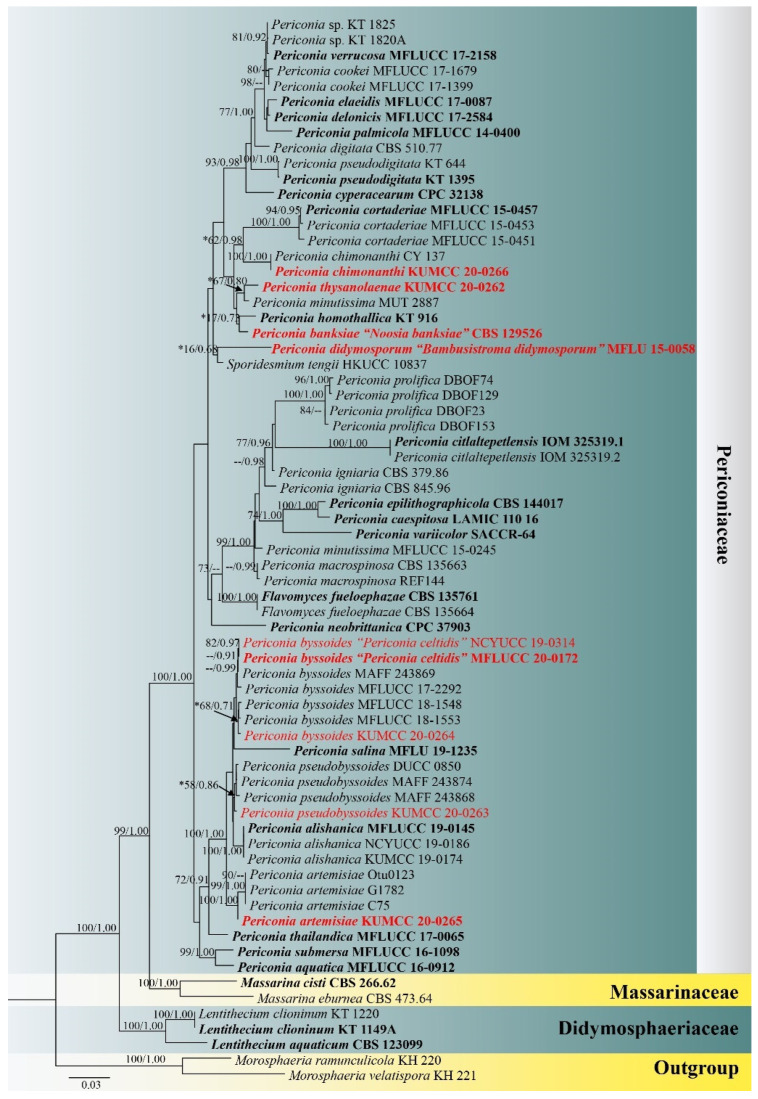
Figure 1.
Phylogram generated from maximum likelihood analysis based on combined ITS, LSU, SSU and tef1-α sequence data. Bootstrap values for maximum likelihood equal to or greater than 70% and Bayesian posterior probabilities equal to or greater than 0.95 are placed above the nodes as ML/PP. An asterisk (*) indicates insignificant support values corresponding with the newly generated strains and discussed species in this study. Ex-type strains are in bold, and the newly generated species and combination species are indicated in red.

