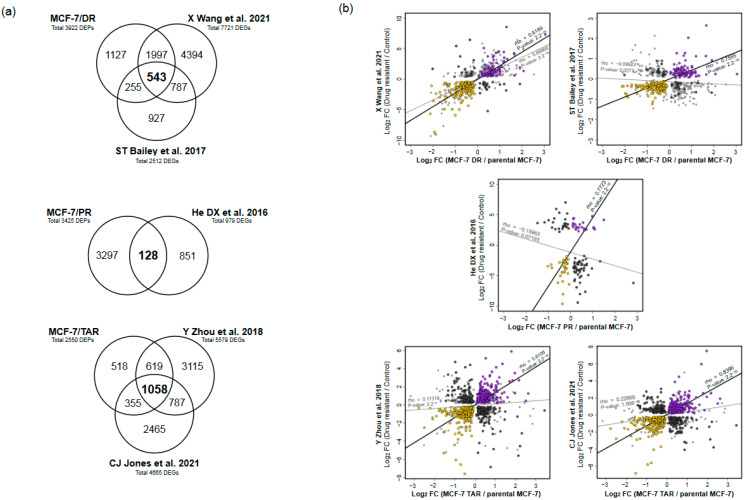
Figure 3.
Integrative analysis of proteome and transcriptome of drug-resistant cells. (a) Venn diagram of significantly differentially expressed genes between proteome and each publicly available transcriptome. (b) Scatter plots of gene-expression correlation between proteome and transcriptome data from each study. Genes for mRNA and protein with increasing concordance were indicated with purple, while genes with decreasing concordance were marked with yellow. Genes that showed discordant changes between proteome and all transcriptome profiles were indicated as dark grey.

